
Kinematic/Dynamic source parameter modeling/inversion
Calculate subfault dislocations from tractions with Okada half-space equation
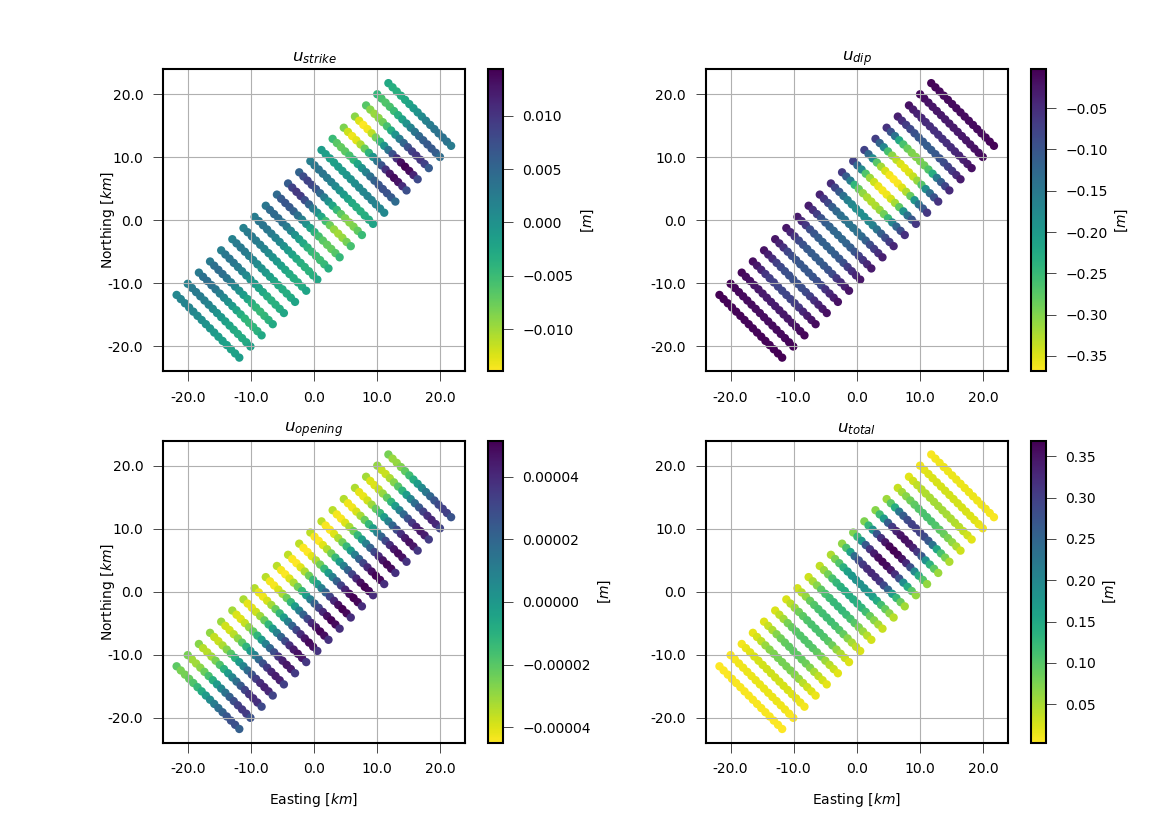
In this example we create a OkadaSource and compute the spatial quasi-static dislocation field caused by a traction field. The linear relation between traction and dislocation is calculated based on Okada (1992) [1].
Download okada_inversion_example.py
import numpy as num

from matplotlib import pyplot as plt
from matplotlib.ticker import FuncFormatter

from pyrocko.modelling import OkadaSource, invert_fault_dislocations_bem

from pyrocko.plot import mpl_init, mpl_margins, mpl_papersize


km = 1e3

# Set source parameters
ref_north = 0*km
ref_east = 0*km
ref_depth = 50.*km

length_total = 50. * km
width_total = 15. * km

nlength = 20  # number of subpatches
nwidth = 16
npoints = nlength * nwidth

al1 = -length_total / 2.
al2 = length_total / 2.
aw1 = -width_total / 2.
aw2 = width_total / 2.

source = OkadaSource(
    lat=0., lon=0., north_shift=ref_north, east_shift=ref_east,
    depth=ref_depth,
    al1=al1, al2=al2, aw1=aw1, aw2=aw2, strike=45., dip=0.,
    slip=1., opening=0., poisson=0.25, shearmod=32.0e9)

# Discretize source and set receiver locations on source plane center points
source_discretized, _ = source.discretize(nlength, nwidth)

receiver_coords = num.array([
    src.source_patch()[:3] for src in source_discretized])

# Create stress drop (traction) array with spatial varying traction vectors
dstress = -1.5e6
stress_comp = 1

stress_field = num.zeros((npoints * 3, 1))

for il in range(nlength):
    for iw in range(nwidth):
        idx = (il * nwidth + iw) * 3
        if (il > nlength / 2. and il < nlength - 4) and \
                (iw > 2 and iw < nwidth - 4):
            stress_field[idx + stress_comp] = dstress
        elif (il > 2 and il <= nlength / 2.) and \
                (iw > 2 and iw < nwidth - 4):
            stress_field[idx + stress_comp] = dstress / 4.

# Invert for dislocation on source plane based on given stress field
disloc_est = invert_fault_dislocations_bem(
    stress_field, source_list=source_discretized, nthreads=0)


def draw(
        axes,
        dislocation,
        coordinates,
        xlims=[],
        ylims=[],
        zero_center=False,
        *args,
        **kwargs):
    '''
    Do scatterplot of dislocation array

    :param axes: container for figure elements, as plot, coordinate system etc.
    :type axes: :py:class:`matplotlib.axes`
    :param dislocation: Dislocation array [m]
    :type dislocation: :py:class:`numpy.ndarray`, ``(N,)``
    :param xlims: x limits of the plot [m]
    :type xlims: optional, :py:class:`numpy.ndarray`, ``(2,)`` or list
    :param ylims: y limits of the plot [m]
    :type ylims: optional, :py:class:`numpy.ndarray`, ``(2,)`` or list
    :param zero_center: optional, bool
    :type zero_center: True, if colorscale for dislocations shall extend from
        -Max(Abs(dislocations)) to Max(Abs(dislocations))

    :return: Scatter plot path collection
    :rtype: :py:class:`matplotlib.collections.PathCollection`
    '''

    if zero_center:
        vmax = num.max(num.abs([
            num.min(dislocation), num.max(dislocation)]))
        vmin = -vmax
    else:
        vmin = num.min(dislocation)
        vmax = num.max(dislocation)

    scat = axes.scatter(
        coordinates[:, 1],
        coordinates[:, 0],
        *args,
        c=dislocation,
        edgecolor='None',
        vmin=vmin, vmax=vmax,
        **kwargs)

    if xlims and ylims:
        axes.set_xlim(xlims)
        axes.set_ylim(ylims)

    return scat


def setup_axes(axes, title='', xlabeling=False, ylabeling=False):
    '''
    Create standard title, gridding and axis labels

    :param axes: container for figure elements, as plot, coordinate system etc.
    :type axes: :py:class:`matplotlib.axes`
    :param title: optional, str
    :type title: Title of the subplot
    :param xlabeling: optional, bool
    :type xlabeling: True, if x-label shall be printed
    :param ylabeling: optional, bool
    :type ylabeling: True, if y-label shall be printed
    '''

    axes.set_title(title)
    axes.grid(True)
    km_formatter = FuncFormatter(lambda x, v: x / km)
    axes.xaxis.set_major_formatter(km_formatter)
    axes.yaxis.set_major_formatter(km_formatter)
    if xlabeling:
        axes.set_xlabel('Easting [$km$]')
    if ylabeling:
        axes.set_ylabel('Northing [$km$]')
    axes.set_aspect(1.0)


def plot(
        dislocations,
        coordinates,
        filename='',
        dpi=100,
        fontsize=10.,
        figsize=None,
        titles=None,
        *args,
        **kwargs):

    '''
    Create and displays/stores a scatter dislocation plot

    :param dislocations: Array containing dislocation in north, east and down
        direction and optionally also the dislocation vector length
    :type dislocations: :py:class:`numpy.ndarray`, ``(N, 3/4)``
    :param coordinates: Coordinates [km] of observation points
        (northing, easting)
    :type coordinates: :py:class:`numpy.ndarray`, ``(N, 2)``
    :param filename: If given, plot is stored at filename, else plot is
        displayed
    :type filename: optional, str
    :param dpi: Resolution of the plot [dpi]
    :type dpi: optional, int
    :param fontsize: Fontsize of the plot labels and titles [pt]
    :type fontsize: optional, int
    :param figsize: Tuple of the figure size [cm]
    :type figsize: optional, tuple
    :param titles: If new subplot titles are whished, give them here (needs to
        four titles!)
    :type titles: optional, list of str
    '''
    assert dislocations.shape[1] >= 3
    assert coordinates.shape[0] == dislocations.shape[0]

    mpl_init(fontsize=fontsize)

    if figsize is None:
        figsize = mpl_papersize('a4', 'landscape')

    fig = plt.figure(figsize=figsize)
    labelpos = mpl_margins(
        fig,
        left=7., right=5., top=5., bottom=6., nw=2, nh=2,
        wspace=6., hspace=5., units=fontsize)

    if not titles:
        titles = [
            'Displacement North',
            'Displacement East',
            'Displacement Down',
            '||Displacement||']

    assert len(titles) == 4

    data = dislocations[:, :3]
    data = num.hstack((data, num.linalg.norm(data, axis=1)[:, num.newaxis]))

    for iax in range(1, 5):
        axes = fig.add_subplot(2, 2, iax)
        labelpos(axes, 2., 2.5)

        setup_axes(
            axes=axes,
            title=titles[iax - 1],
            xlabeling=False if iax < 3 else True,
            ylabeling=False if iax in [2, 4] else True)

        scat = draw(
            *args,
            axes=axes,
            dislocation=num.squeeze(data[:, iax - 1]),
            coordinates=coordinates,
            **kwargs)

        cbar = fig.colorbar(scat)
        cbar.set_label('[$m$]')

    if filename:
        fig.savefig(filename, dpi=dpi)
    else:
        plt.show()


# Plot
plot(
    disloc_est.reshape(npoints, 3),
    receiver_coords,
    titles=['$u_{strike}$', '$u_{dip}$', '$u_{opening}$', '$u_{total}$'],
    cmap='viridis_r')
Footnotes