

Sparrow - geospatial data visualization
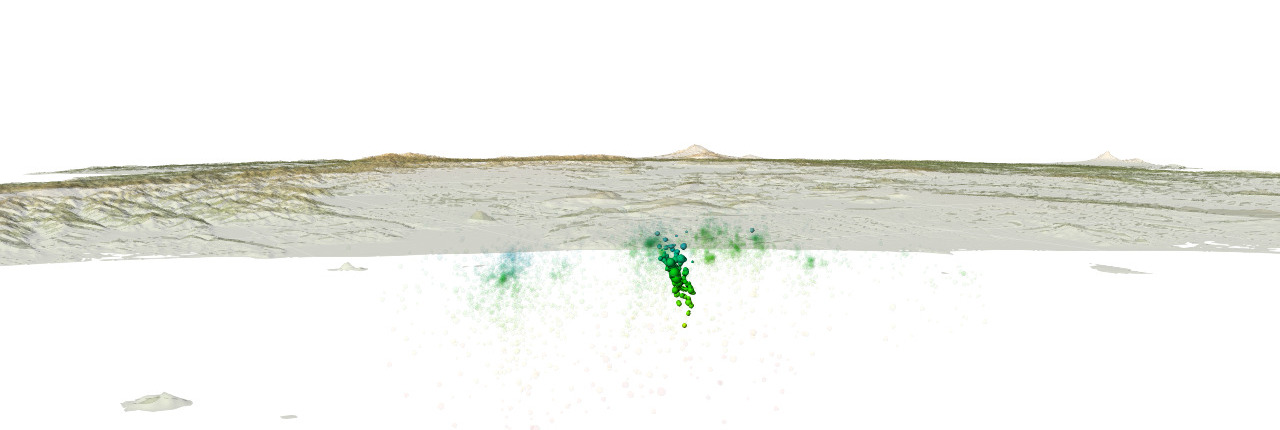
The Sparrow application provides a virtual globe to visualize earthquake hypocenters, earthquake source models, fault traces, topography datasets and other geophysical datasets in 3D and over time. Its primary focus is on simplicity, allowing for interactive dataset exploration and export of short animations.
Note
The Sparrow application is currently in an experimental stage.
There may be some bugs for you to discover.
Some essential features might still be missing.
Please help us by providing feedback through Issues, Discussion, or Coding.
We are grateful for any feedback, even if it is just “it worked fine” or “I find it annoying that…”.
Requirements
The Sparrow has one additional requirement which (on purpose) is not listed as a hard dependency for a default installation of Pyrocko: VTK. Please install it with your installation method of choice (e.g. on a deb based Linux, use
apt install python3-vtk9, in a pip-managed environment usepip install vtk, or under Anaconda/Miniconda useconda install vtk).Make sure your graphics card driver setup allows for hardware-accelerated OpenGL (e.g. check with
glxinfo -B, look forOpenGL renderer). If you have an NVIDIA graphics card, you may want to install their proprietary drivers.For visualization of InSAR scenes, Kite is needed.
Invocation
Run sparrow from the command line to launch into Sparrow’s graphical user
interface (GUI). To get a list of its options, run sparrow --help.
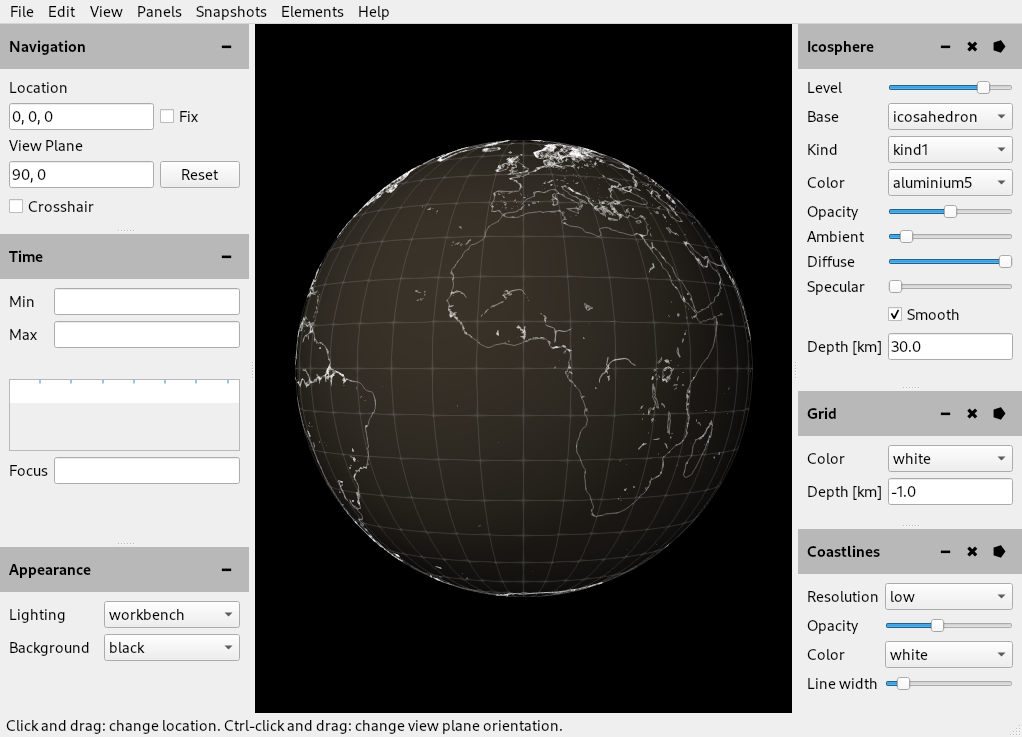
Figure 1: Startup state of the Sparrow GUI, with Icosphere, Grid and Coastline elements. Tipps are shown in the status bar at the bottom.
First flaps
Online help
Instructions and help are shown in the status bar at the bottom of the window.
Tutorial
On first startup, a tutorial is shown. The tutorial can also be activated from the Help menu.
Navigation
There are two navigation modes, normal and fixed. In normal mode the location of the focal point is changed when you click and drag the mouse, in fixed mode, the location is fixed and the view angles are changed when you click and drag. Navigate to a point of interest in normal mode and then click Fix in the Navigation panel to investigate your target. You can also hold down the control key to toggle between the navigation modes.
The focal point is visually shown when Crosshair in the Navigation panel is checked.
The depth of the focal point can be set by modifying the third value in the Location field. Enter a depth [km] below sea-level. Use negative values to lift the focal point above sea-level.
Elements
The scene shown in the view is composed of a variable number of elements. By default the Icosphere, Grid and Coastline elements are shown. More elements can be added through the Elements menu. The elements can be configured with their associated control panels. Their title bar controls do as follows:
✖ Remove the element from the scene.
⭓/⭔ Toggle the visibility of an element.
━ Hide the control panel. It can be regained via the Panels menu. The element will still be shown in the scene.
Two useful elements are:
Catalog: Display earthquake catalogs. Click File and select a catalog in Pyrocko format (basic or YAML) to get started.
Topography: Display ETOPO and SRTMGL3 topography/bathymetry with adjustable transparency and variable vertical exaggeration. Pre-download the datasets using the Pyrocko commands
automap --download-etopoandautomap --download-srtmgl3(about 36 GB).
Further elements allow display of
subtitles
time counters
station locations
InSAR displacements
source models
faults
volcanoes
and more…
If you would like to implement a new element and need some pointers to get started, have a chat with us in the Sparrow channel on the Pyrocko Hive.
Snapshots and animations
To capture the state of the current scene with all its settings, use the Snapshot tool which is available from the Panels menu. You can go back to any snapshot by double-clicking its thumbnail. The snapshot tool also allows you to transition between snapshots. This is done by interpolating the numerical state values (where possible) between the two snapshot states. Double-click the transition indicator between the snapshot thumbnails to preview the transition.
Simple animations can be made by arranging multiple snapshots and transitions into a timeline. The animations can be exported as MP4 movies to show-off your research findings in a feasible and convenient way. By default the movies are exported in Full HD size (1920 x 1080 pixels). Other formats can be chosen by setting the size of the visualization canvas via the View menu. For movie export to work, the FFmpeg tool must be installed. To export a still image, use Export Image… from the File menu.
Snapshot sequences can be saved as YAML text files. You may edit these files with a text editor, or create or manipulate them from a script. YAML files can be read/written in Python using pyyaml in an agnostic way or by using the dedicated loaders in Pyrocko for full featured access.
Textual manipulation of the Sparrow’s state
The internal state of the currently visible scene can be represented as a YAML document. If you detach the 3D view into a separate window (using Detach from the View menu), this YAML document becomes available in the main window. Manipulating the state in this textual representation can sometimes be more efficient or more precise than through the GUI.