Snuffler tutorial
This document describes basic usage of Snuffler.
First steps
Suppose we want to have a quick look on some seismic waveforms in a file test.mseed. The file is in Mini-SEED format, which is the default file format, when working with Snuffler. Download the file, then run the command:
snuffler test.mseed
A window should open:
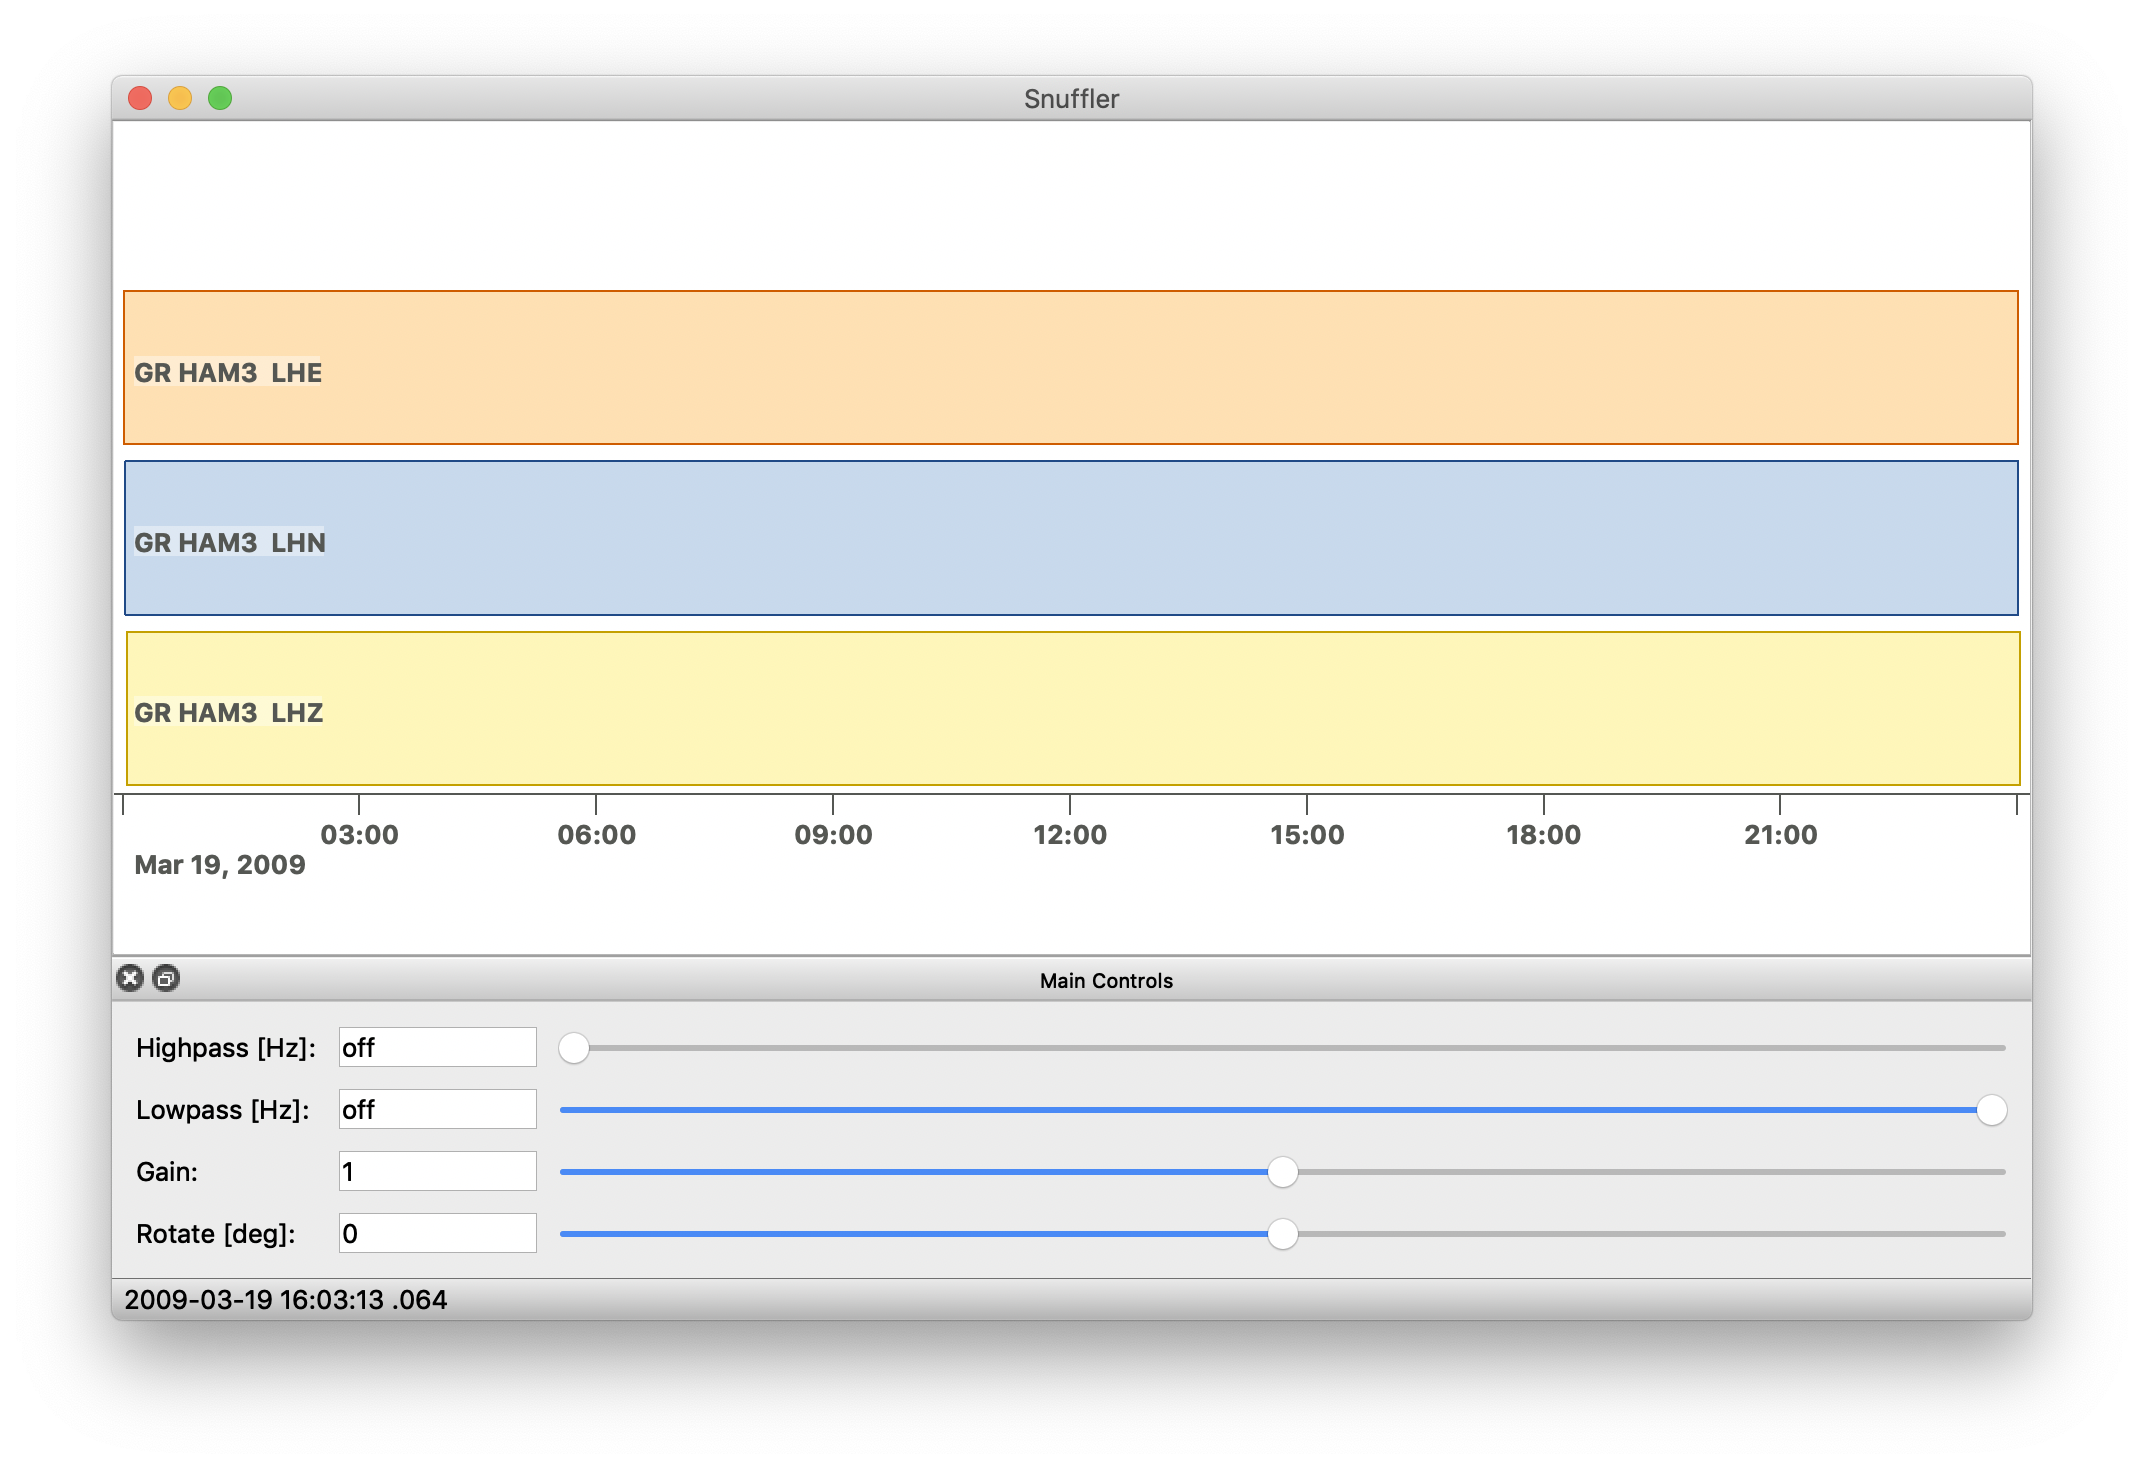
Initially, no waveforms are shown. That is perfectly ok.
Now use the mouse! Press and hold the mouse button to navigate: draging it sideways will bring you back and forth in time, pushing and pulling will zoom out and in, respectively.
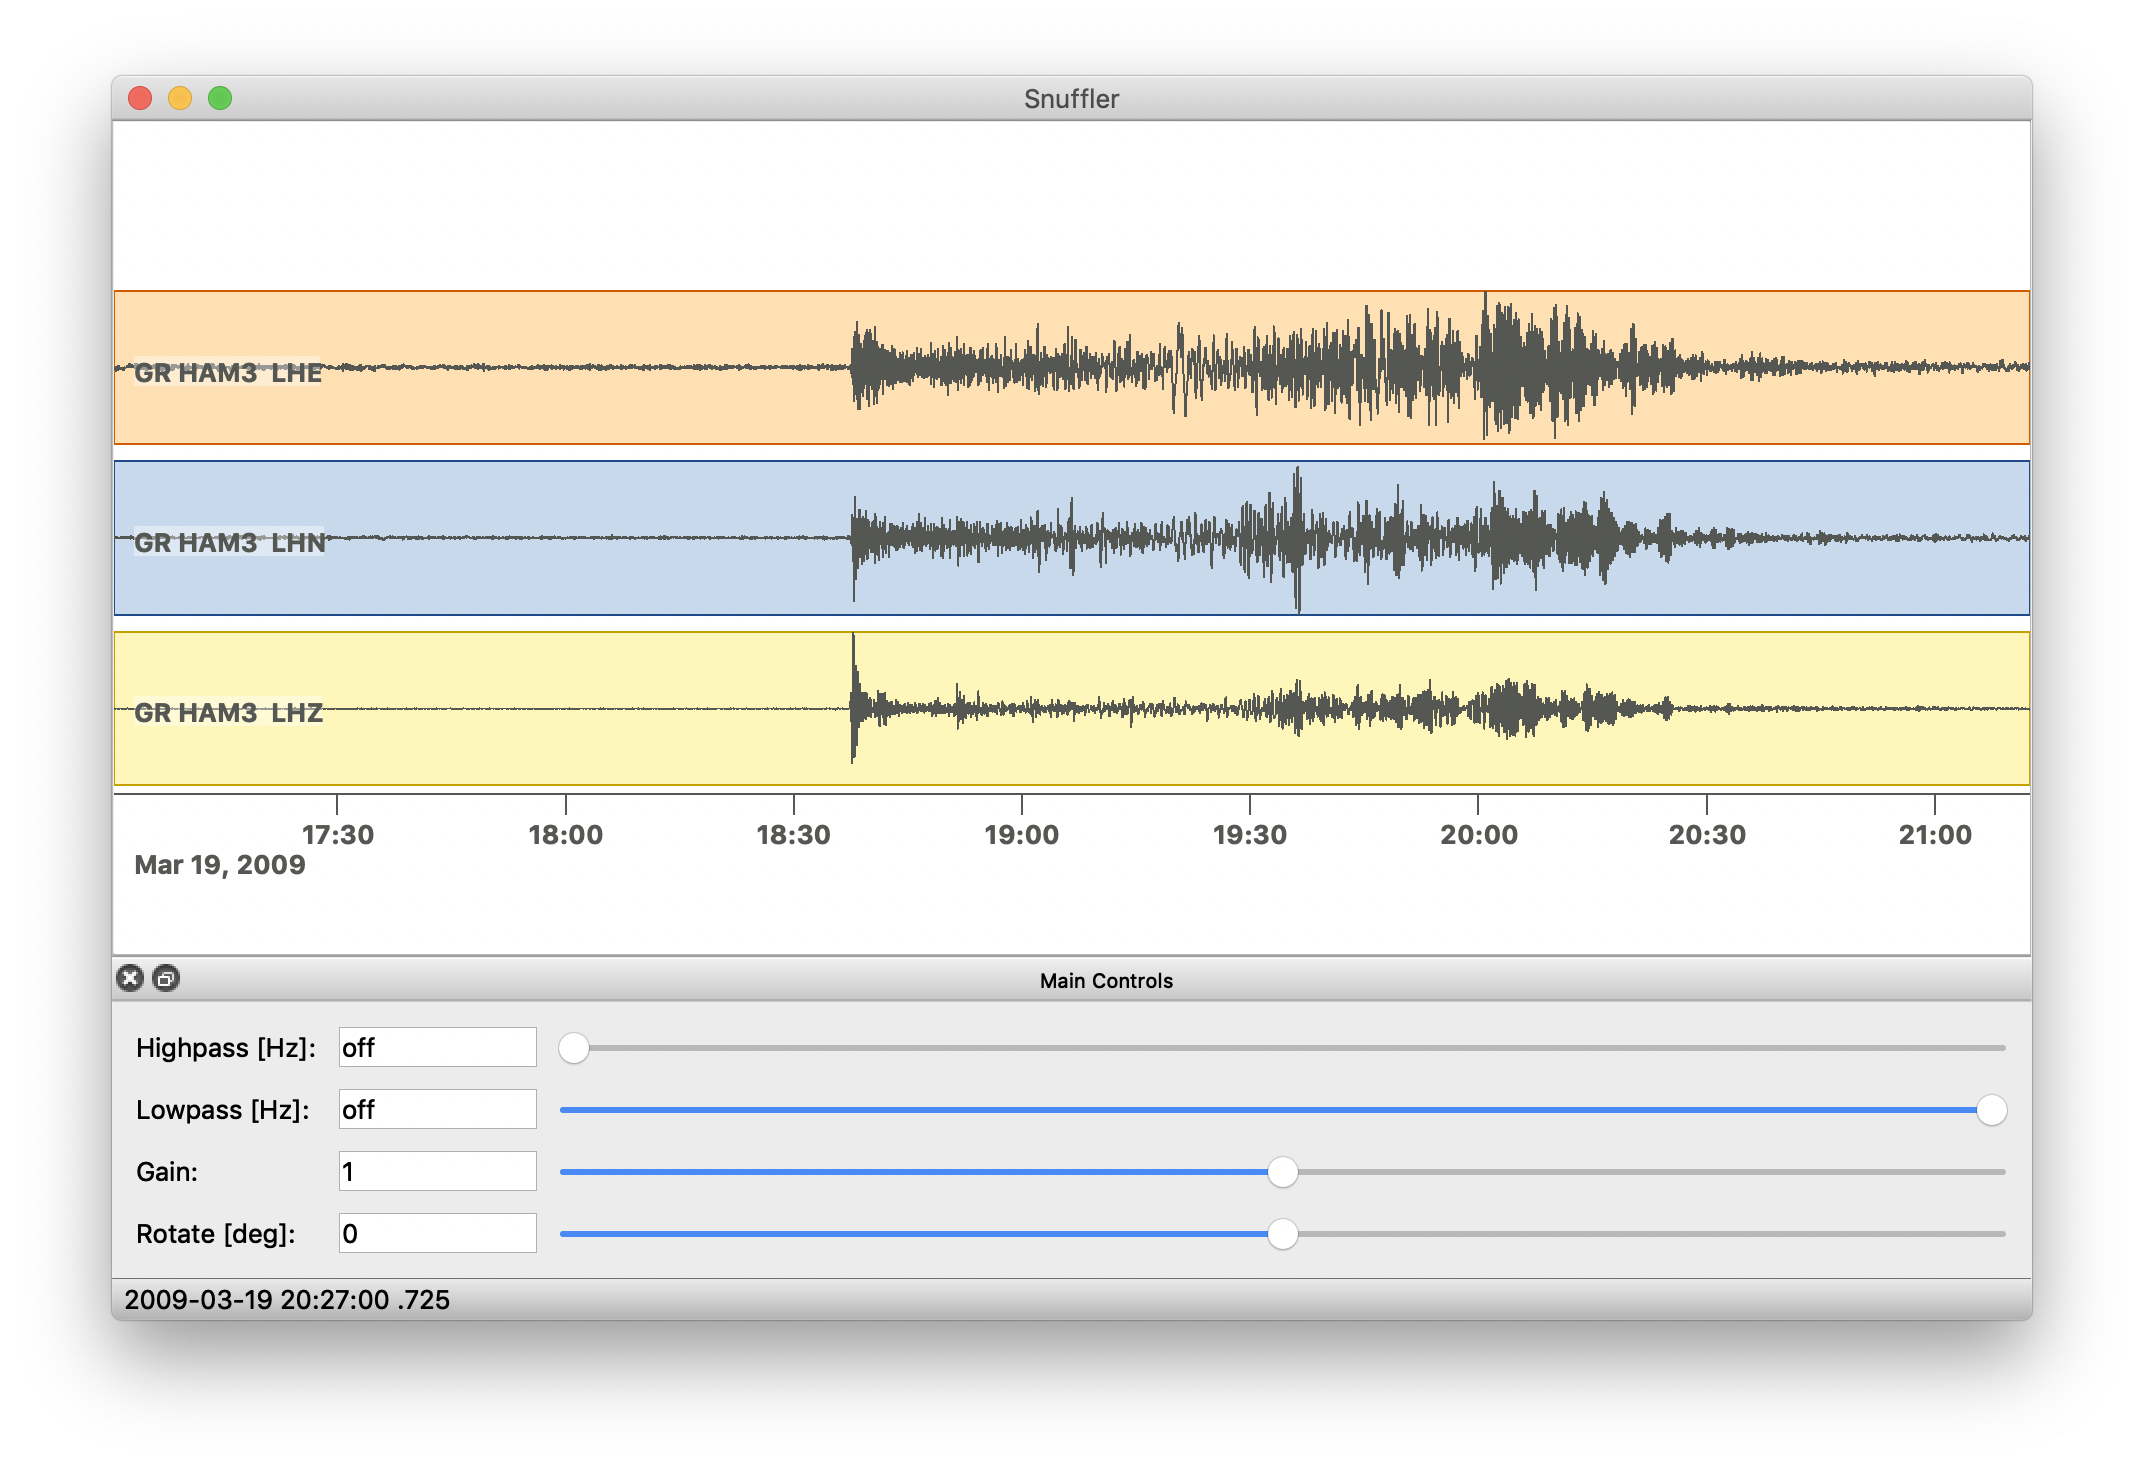
If you zoom in close enough, the trace data will appear:
There are some more commands to navigate. The <space> key brings you one page forward in time, b does the opposite. Press ? for a list of key bindings.
Things to remember for now are:
Full screen display is toggled by pressing f.
Snuffler has a main menu, which is accessed by pressing the right mouse button within the trace view.
Snuffler has a command line, which is accessed by pressing : (colon).
Using the mouse wheel while holding down <control> allows you to quickly change the number of tracks shown on display.
How to get help:
Press ? or select Help from the main menu.
Use
snuffler --helpto see what command line options are available.There is a Snuffler manual
Before continuing, you should make yourself a bit familiar with basic navigation in Snuffler.
Big datasets
Snuffler will only show waveform data, when there are not too many data samples within the current view. Zoom out to get an overview on what is available - zoom in to see the waveforms. With this behaviour, it is possible to quickly get an overview over tens of thousands of files without any problems.
Here’s an example of just a few thousand files:
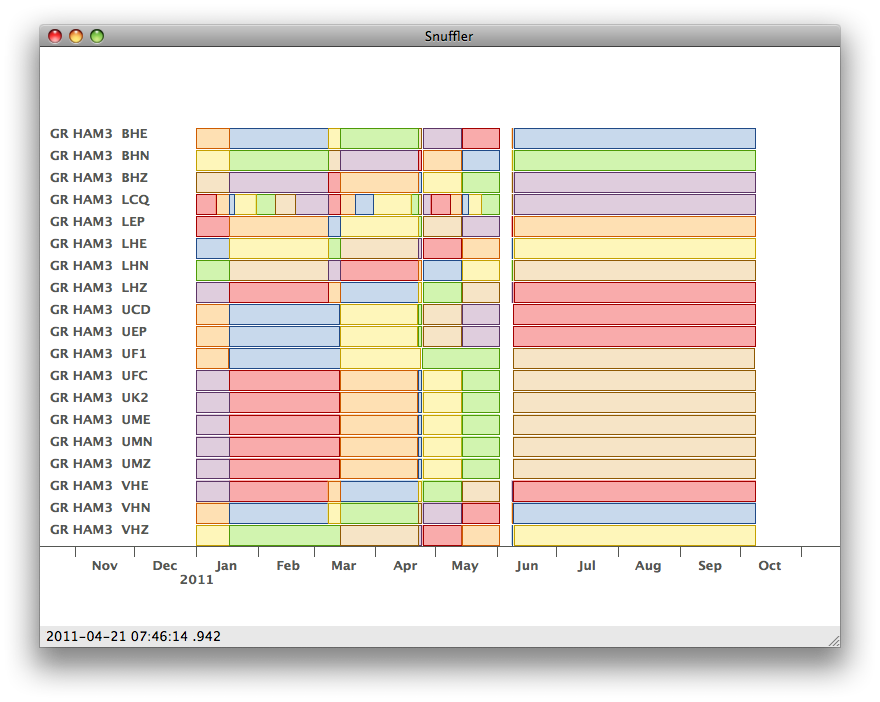
If color is continuous, so is the trace (no gaps). If there is a gap in the data, color changes. Which color it uses does not have any special meaning.
No data is actually loaded in overview mode. But of course, all file headers have to be read when Snuffler encounters any new files. Fortunately, the trace meta information is written to a cache. So, if Snuffler is started with files it has seen before and which have not been modified meanwhile, startup time is a snap.
Note
By default, the cache is stored in a directory under /tmp. This
directory is usually emptied on restart of the computer. It is possible to
use a custom location, when you have a very large set of files and don’t want
to loose the meta data cache on restart. This can be set with the
snuffler --cache command line option.
You may now use this small example dataset testdata.tar with 153 files from some stations in Germany (3 days, 17 stations with 3 channels each, 23MB).
Untar the file and look at the data using Snuffler:
tar -xvf testdata.tar
snuffler testdata
Yes, Snuffler will recurse into that directory and use all files it can read! Of course, you can also restrict it to use only specific files:
snuffler testdata/*LHZ*
Note
When using shell globbing like this, you may bump into the maximum command
line length limit. This is because the shell expands the * argument
into lots of filenames and most shells have a limit on how long a command
line can be. If that happens, you may use the snuffler --pattern
command line option to avoid that problem:
snuffler --pattern='.*LHZ.*' testdata
The pattern argument is a regular expression, so ‘.*’ is used instead
of ‘*’ and it must be protected from shell command line processing
using quotes.
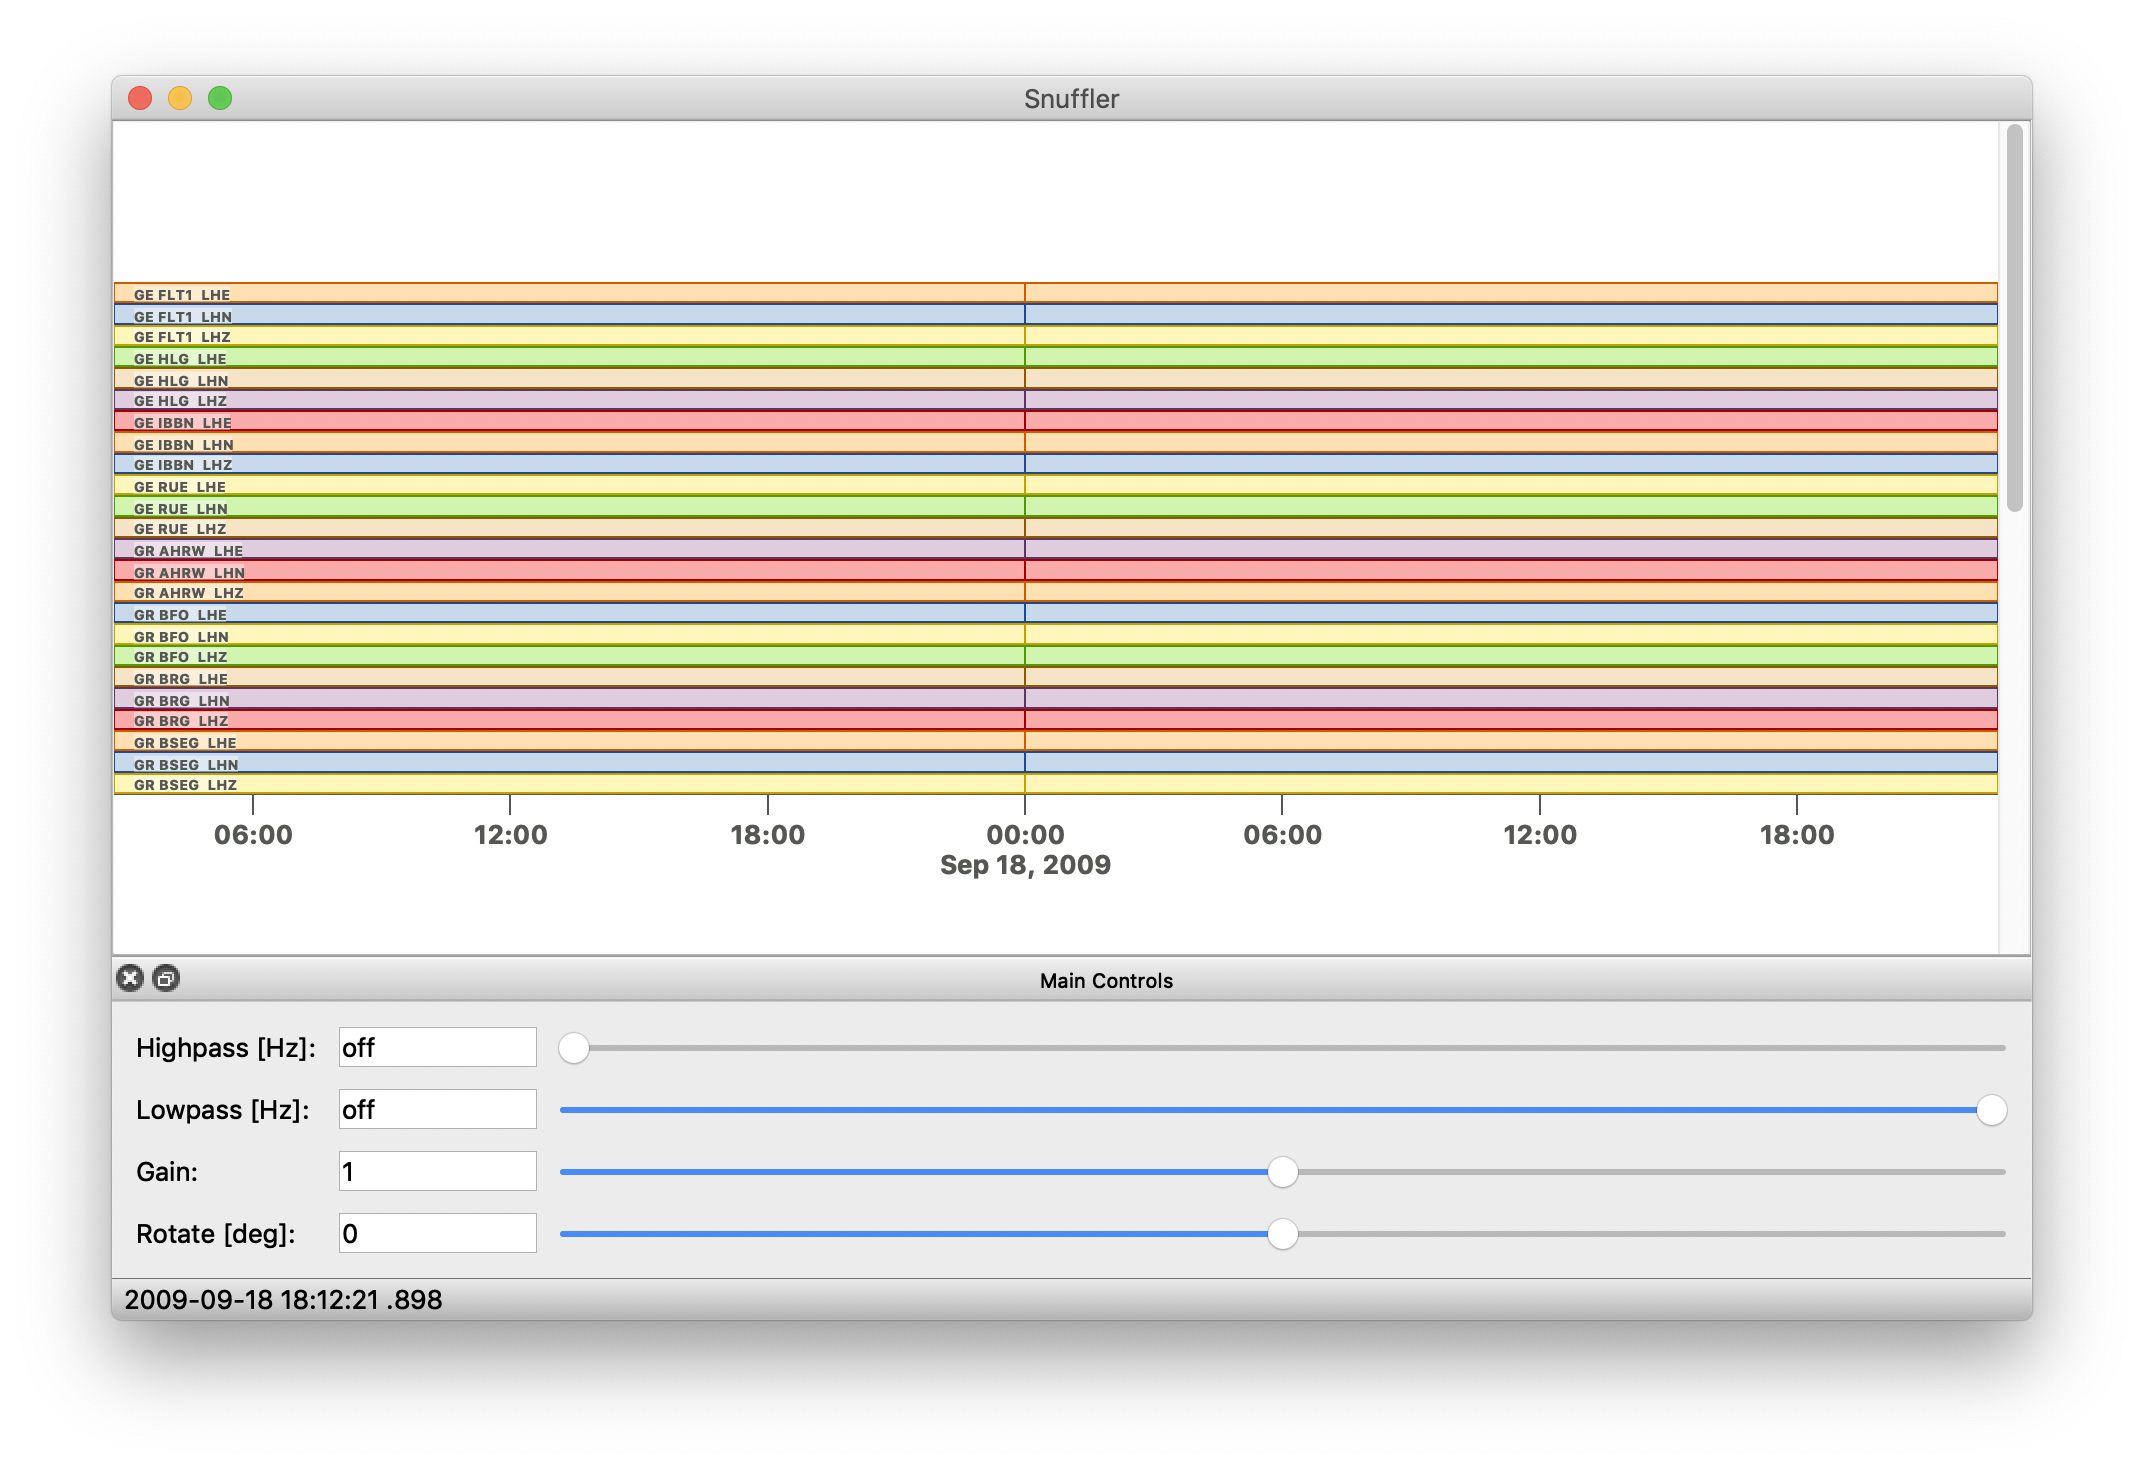
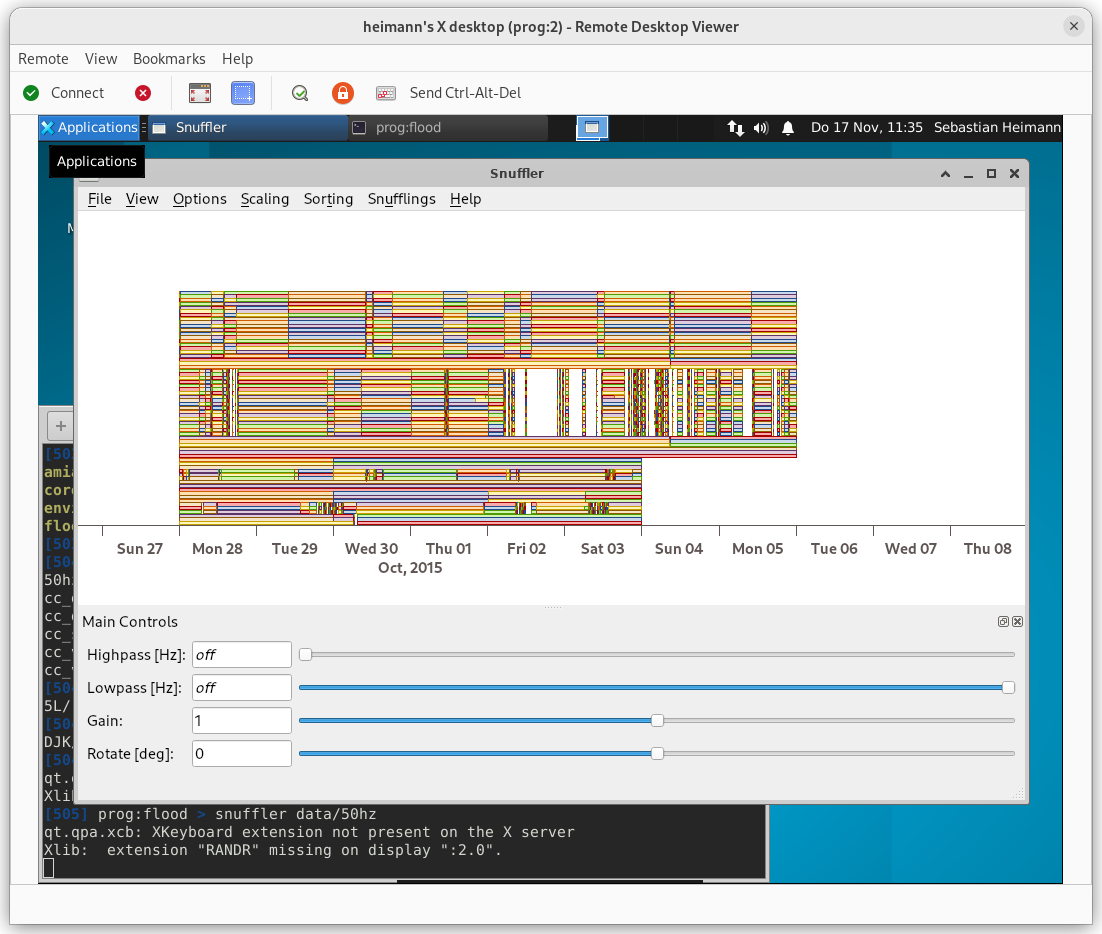
Colored rectangles are shown for each file, so we can immediatly see that this dataset is cut into day-files. That there is no change in color at midnights indicates, that there is no gap in the recordings however. Take a closer look at 2009-09-19 00:00. Zoom in until the traces appear, filter a bit.
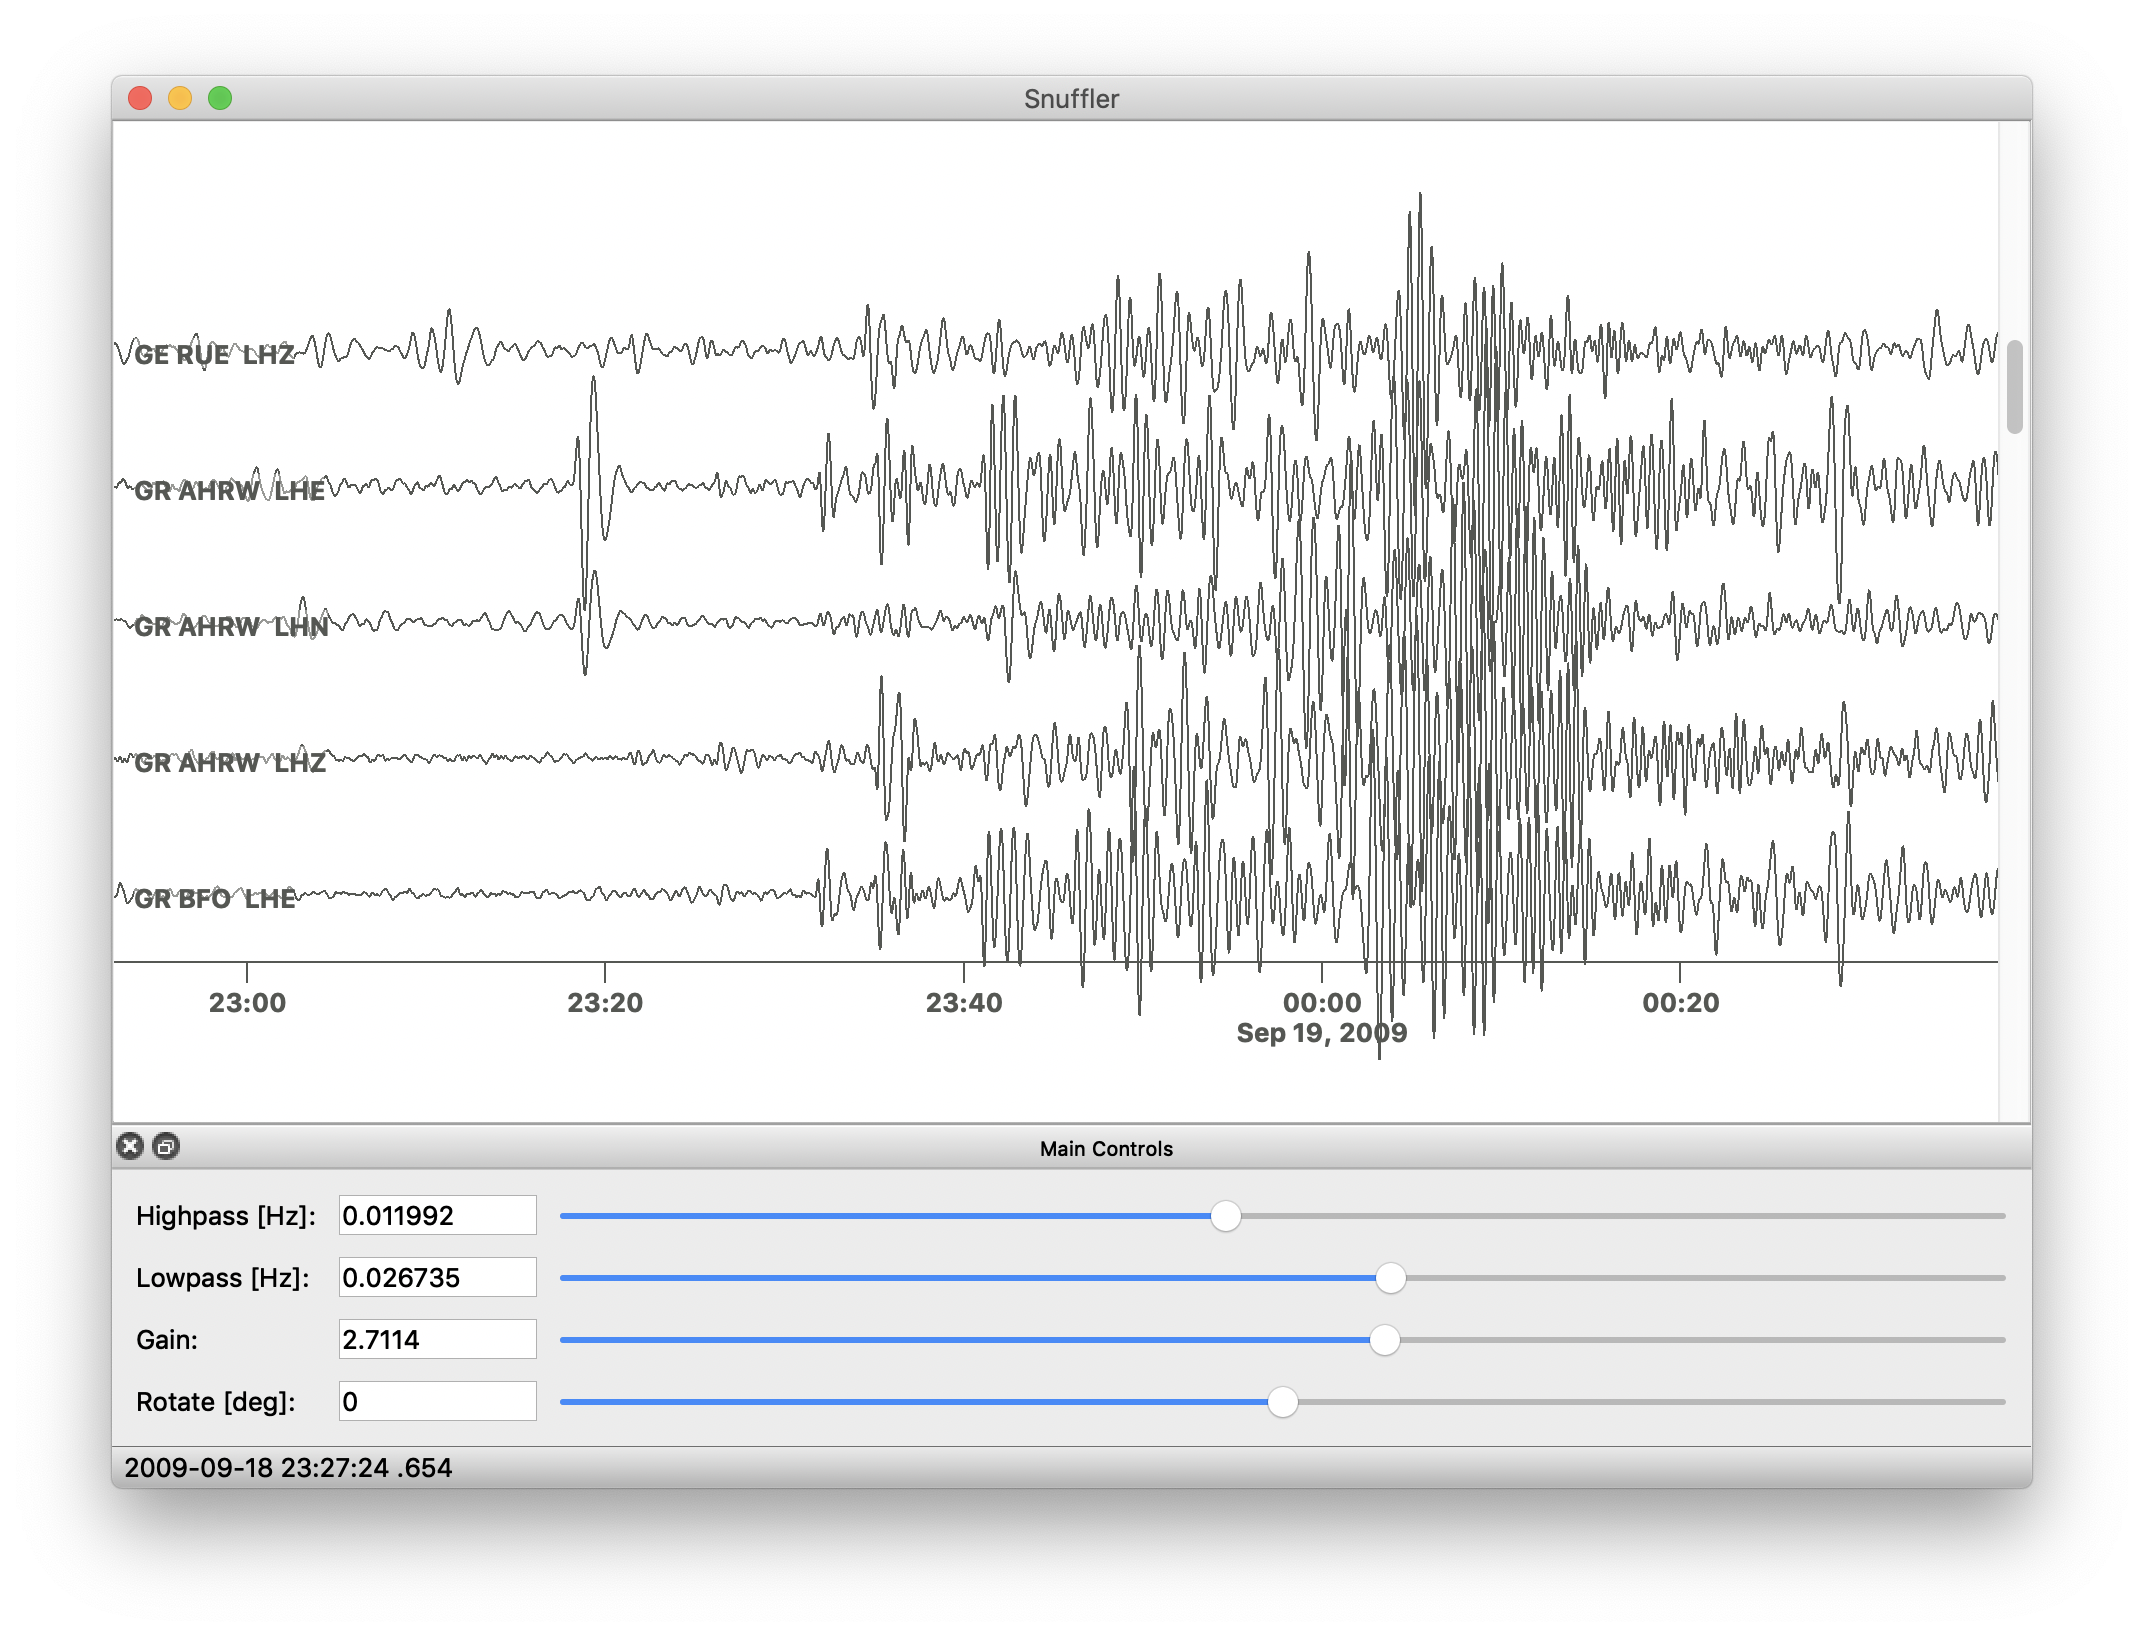
Oh, there’s an earthquake spanning the file boundaries!
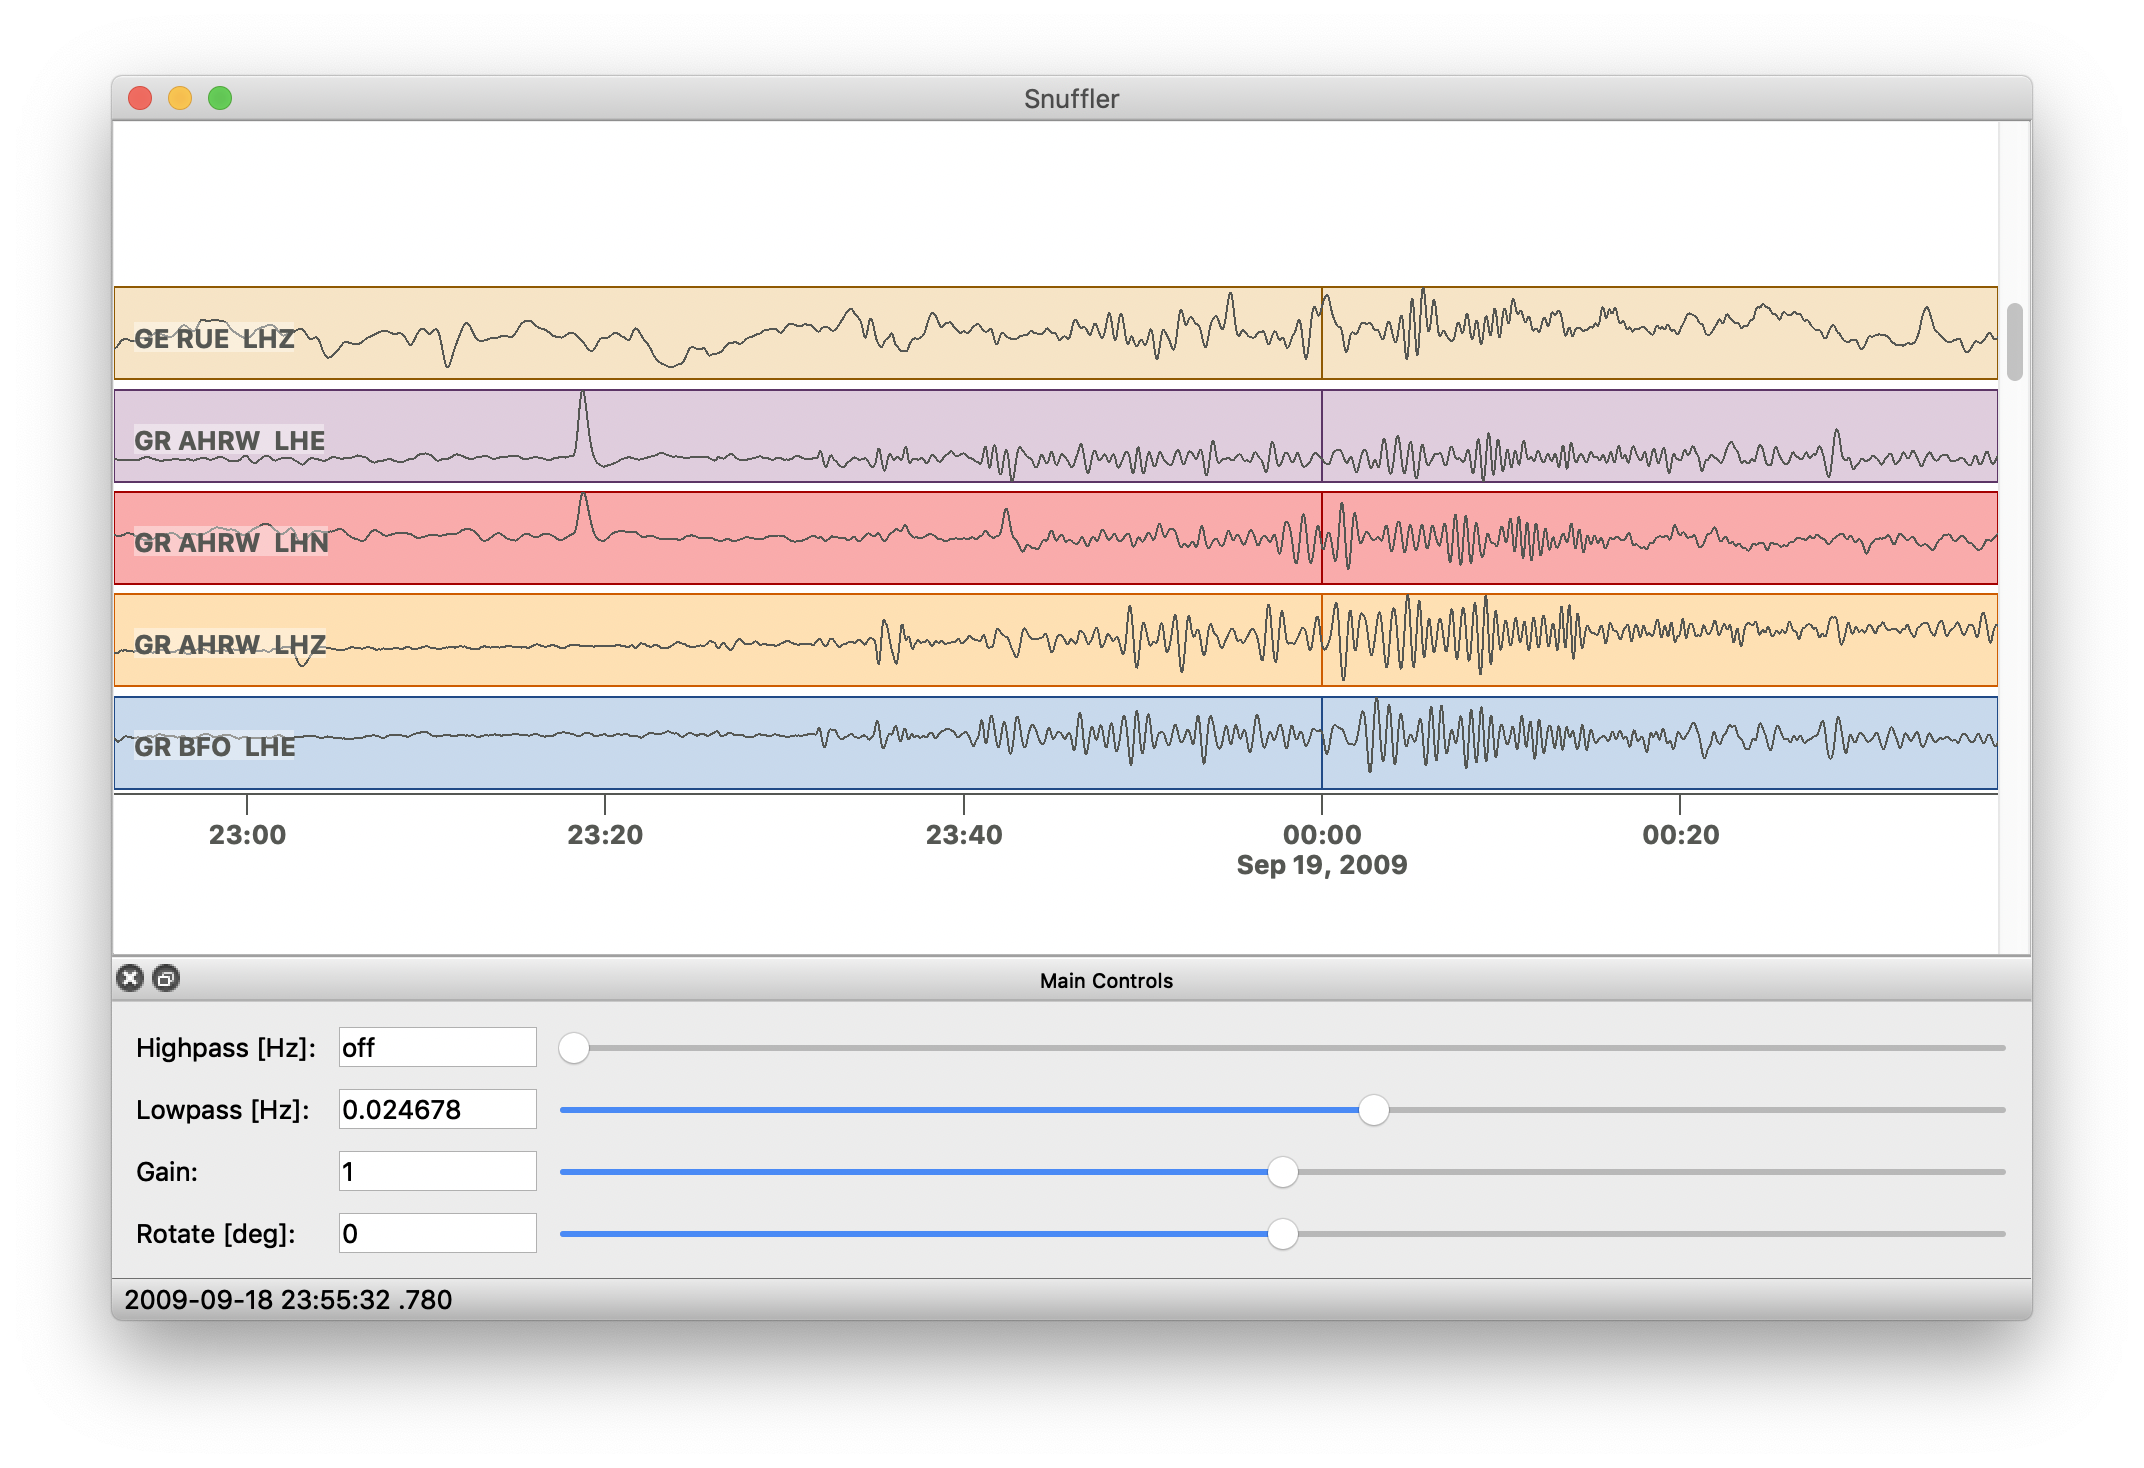
Notice, that the filtering works seamless across the file boundaries! By default, Snuffler will try to connect adjacent traces. This feature can be turned off in the right-click menu under Allow Degapping. Turn it off, to see some filter artifacts at the boundary! Then turn it on again.
Note
When the lowpass is active and its corner frequency is way below the Nyquist frequency, the signal will be downsampled first and then filtered. This reduces the number of samples to display on screen, allowing for a larger time window to be shown at once. However, downsampling and filtering will require some processing power, so the responsiveness of the application may drop when viewing long timewindows at frequencies way below the Nyquist frequency. You may want to downsample the whole dataset in advance in such a case (there is no need to work with 200Hz recordings when looking at e.g. long period surface waves).
Occasionally, the downsampling process may be disturbing. It can be turned off in the right-click menu under Allow Downsampling.
If you are working with big datasets which are stored remotely and you are using x-forwarding to access the data it might be to slow. Under Remotely stored data we show an alternitive using VNC.
Scaling
Several options control the relative and absolute scaling of the waveforms. The relative scaling mode and the scaling base can be selected in the right-click menu. The Gain slider in the Main Controls panel multiplies the traces on display by an additional factor to quickly magnify some small features. Normally the traces are clipped within the color boxes, but you may choose to turn off display of the boxes and to disable the clipping.
The current scale range on each track is shown when Show Scale Range in the right-click menu is selected.
Events and station coordinates
Now we might like to sort the stations according to distance to the event. To
do this, Snuffler needs station and event coordinates. A simple way to tell
Snuffler something about your stations is via the snuffler --stations
command line option:
snuffler --stations=testdata/stations.txt testdata
The stations.txt file is a simple text file in the format descibed in
section Basic station files.
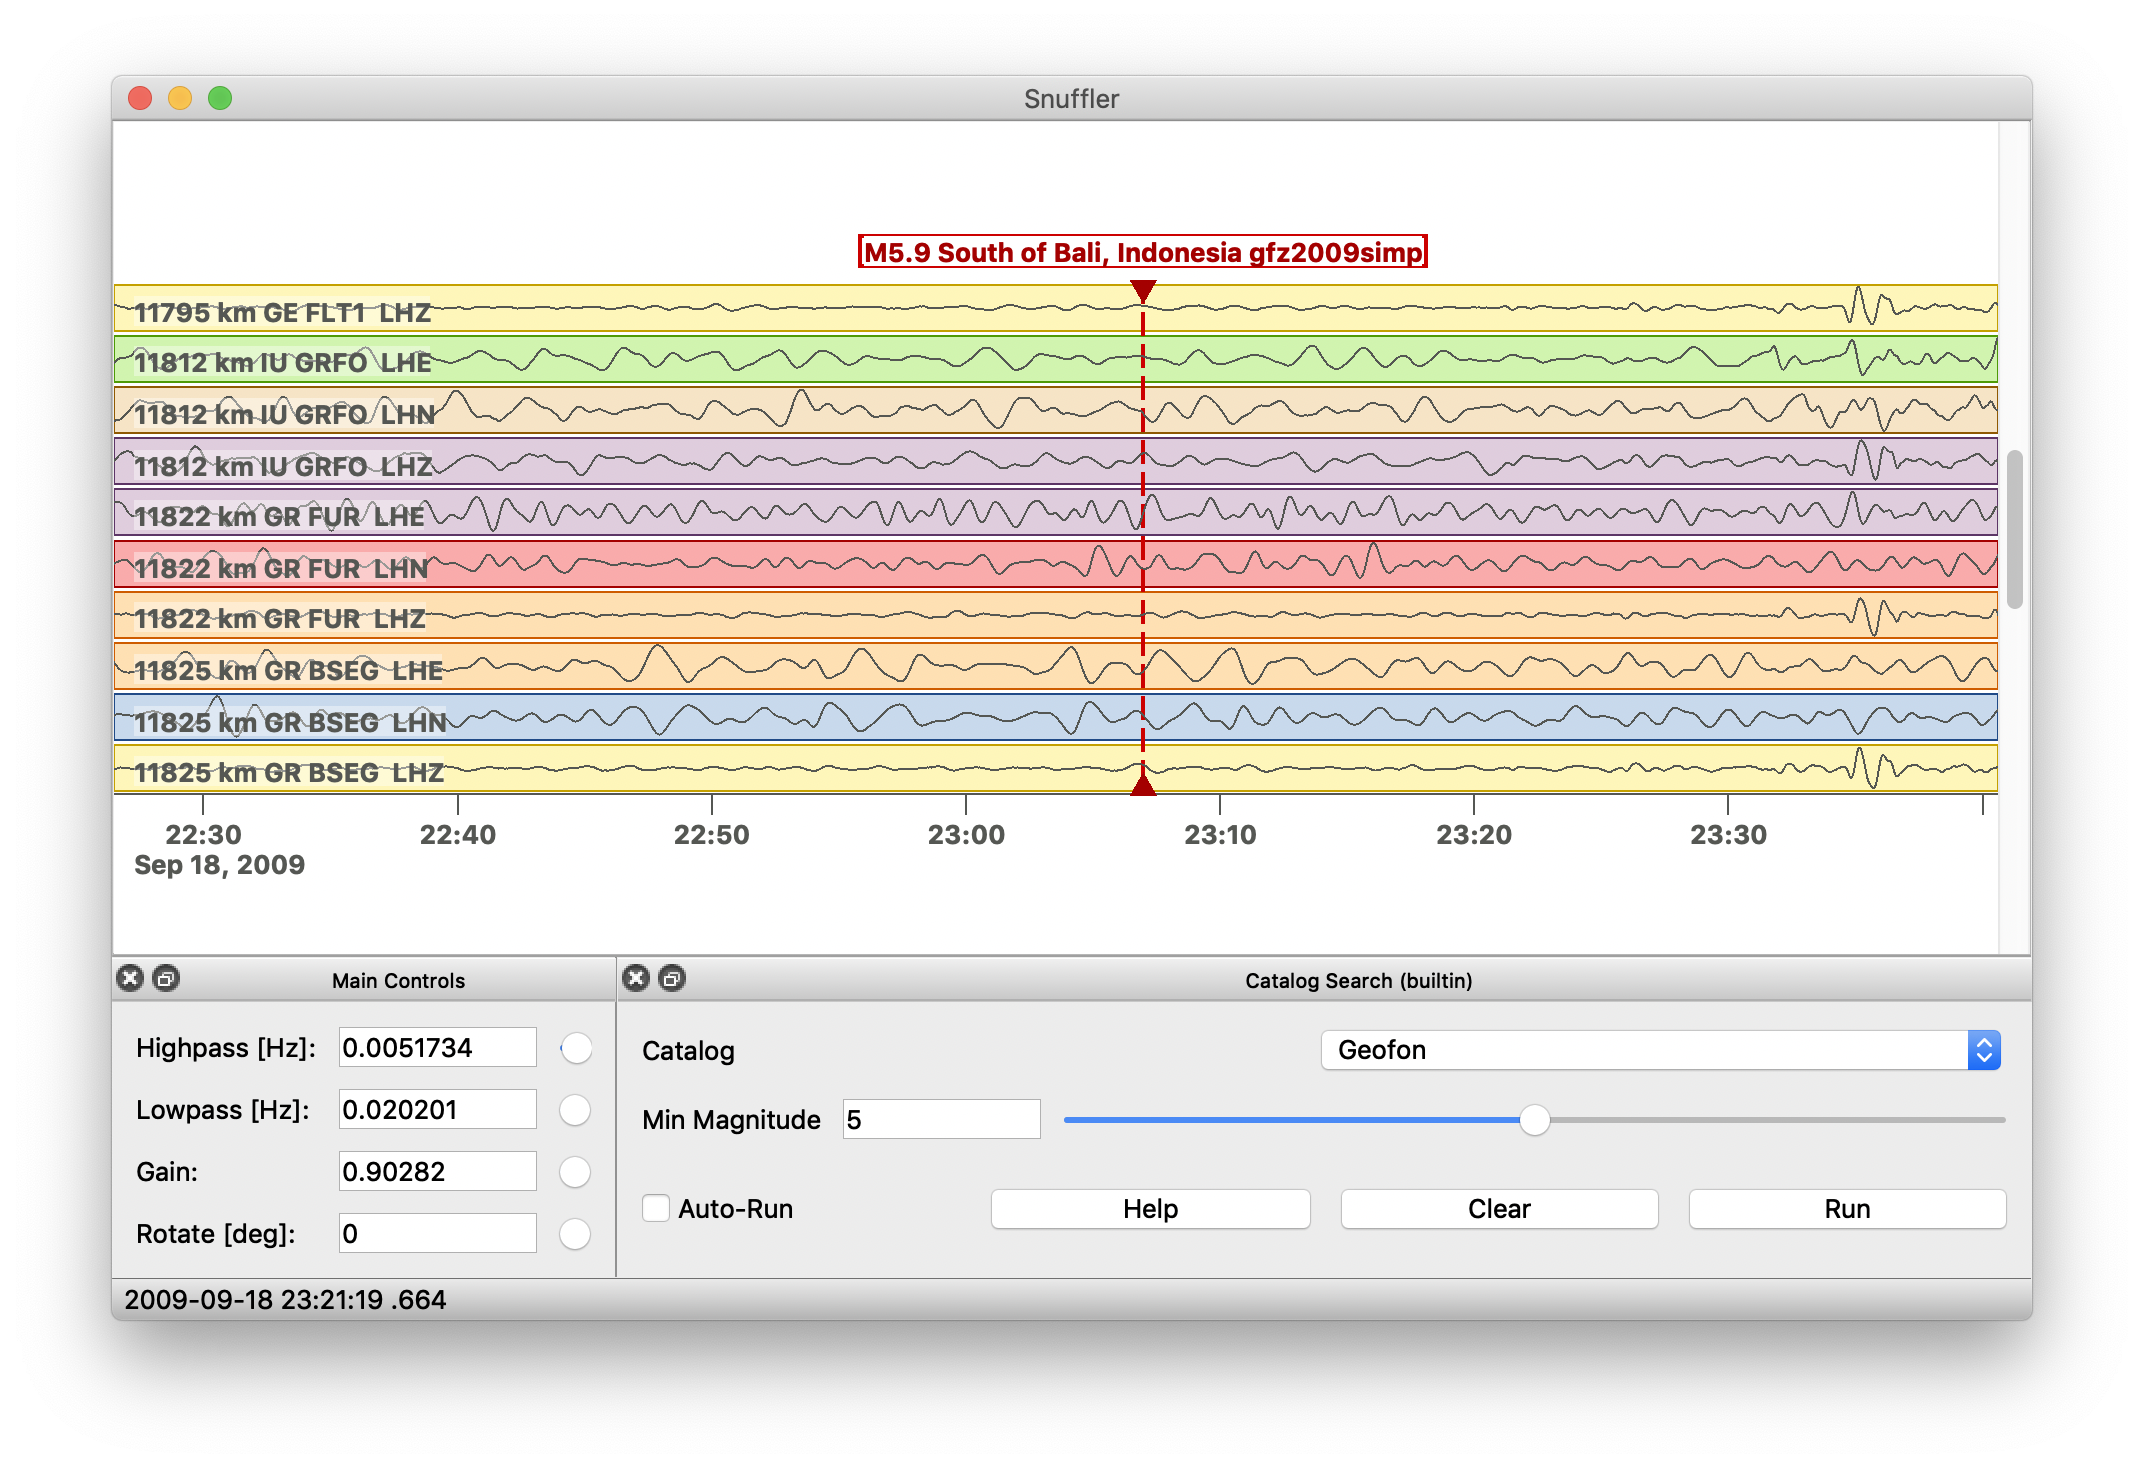
Event information can come from various sources. In our example dataset, we are most likely seeing a global earthquake, so we may query one of the global earthquake catalogs. In the main menu select . A panel opens in the bottom part of the Snuffler window. Make sure you have internet access, select a minimum magnitude and hit Run.
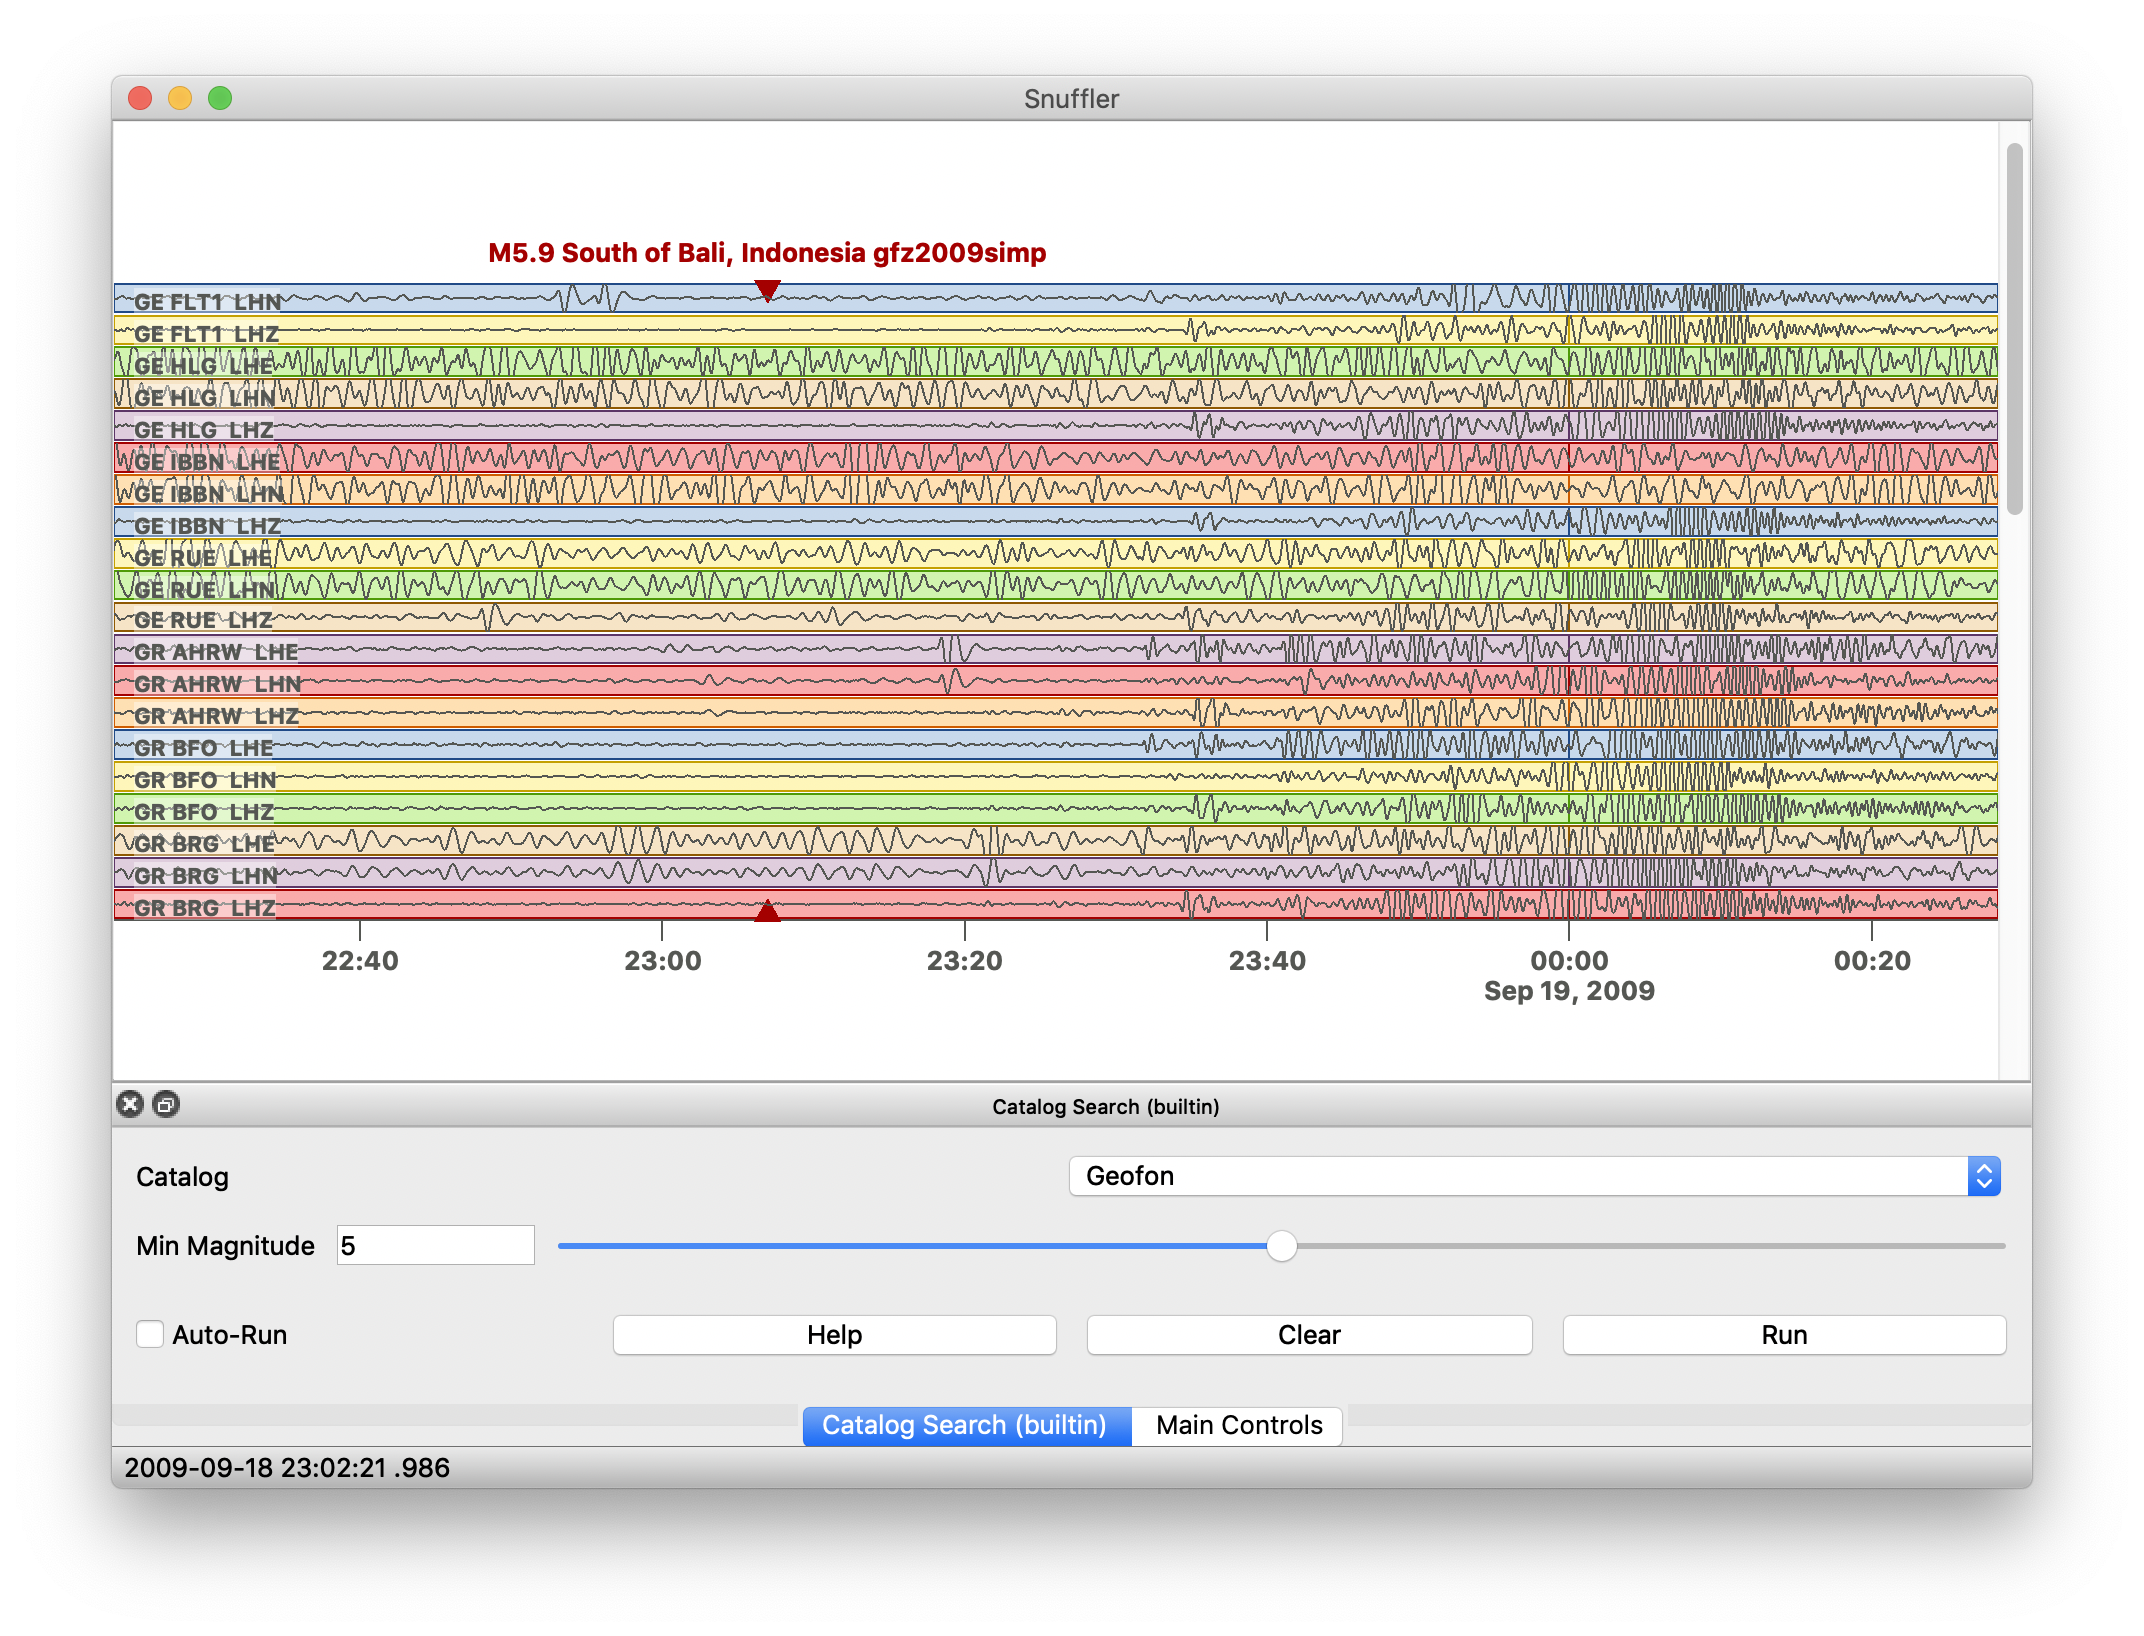
Aha, so this one is coming in from Bali!
Note
This catalog search feature queries the web page of the given catalog for the time range currently in view, so please use this in a civilized manner. Uneccessarily large queries may look like a denial-of-service attack to those running the catalogs.
You should now select the event marker with a single click. Now press e (like “event”) to make this the active event. The active event is used as the origin for distance computations (among other things discussed later). There can only be one active event at a time (while several may be selected). To distinguish the active event from other events, it is marked with a box around its name.
Now select Sort by Distance in the main menu.
There’s your traces sorted by distance to the event.
Markers
Three different types of markers are available in Snuffler: normal markers, phase markers, and event markers. To create a new normal marker interactively, double-click the mouse to activate picking mode, then click where you want to put it. With click and drag, markers spanning a time interval may be created. The markers may either be attached to a certain trace (via network/station/location/channel ID) or may serve as time (span) markers only. The latter can be created by clicking on the time axis rather than on the traces. Here are some different normal markers:
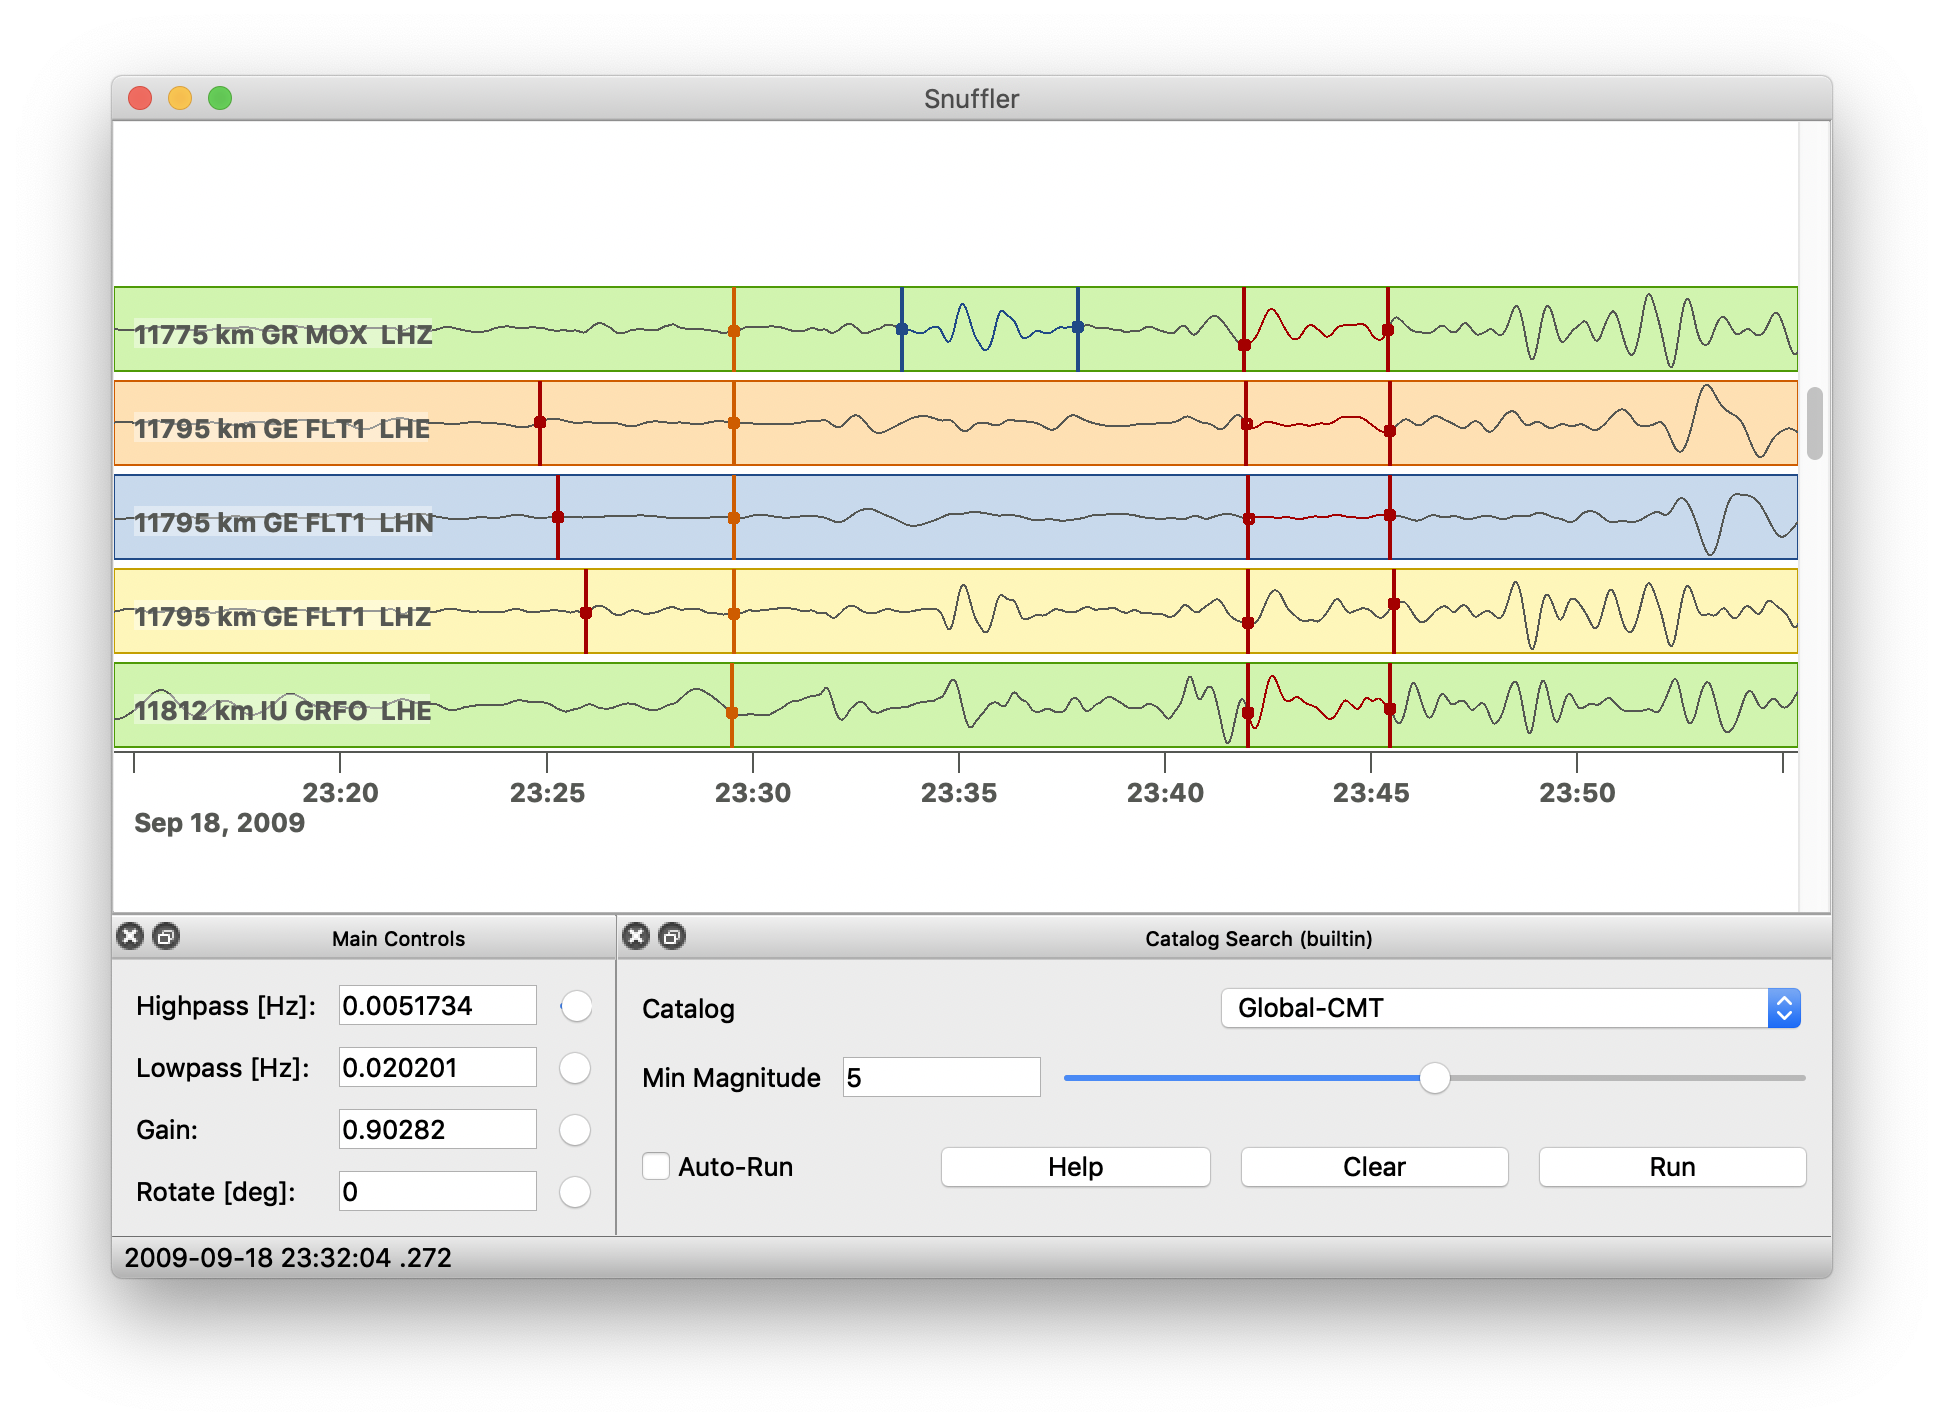
A color may be assigned to the selected markers using the number keys 0 - 5.
To enhance a normal marker to a phase marker, use the function keys
<F1> - <F9>. The mapping of <F> keys to phase names can be
modified in the snuffler configuration file: ~/.pyrocko/snuffler.pf.
A phase marker differs from a normal marker by having a phase name and in
that it may be associated to an event.
Normally, phase markers are associated to the current active event (see above). If there is no active event, you may associate them later. To (re)associate a phase marker to an (other) event, select both, phase marker and event, then press e (use the shift key while clicking to select more than one marker). <F10> converts a phase marker back to a normal marker.
To enhance a normal marker to an event marker, select the marker and press e (the new event marker will also be the new active event).
Note
Here’s a little trick: an event marker created like this will have as origin the coordinates of the station of the trace on which the original normal marker was created. This way, you can easily sort the traces according to their distance to this station.
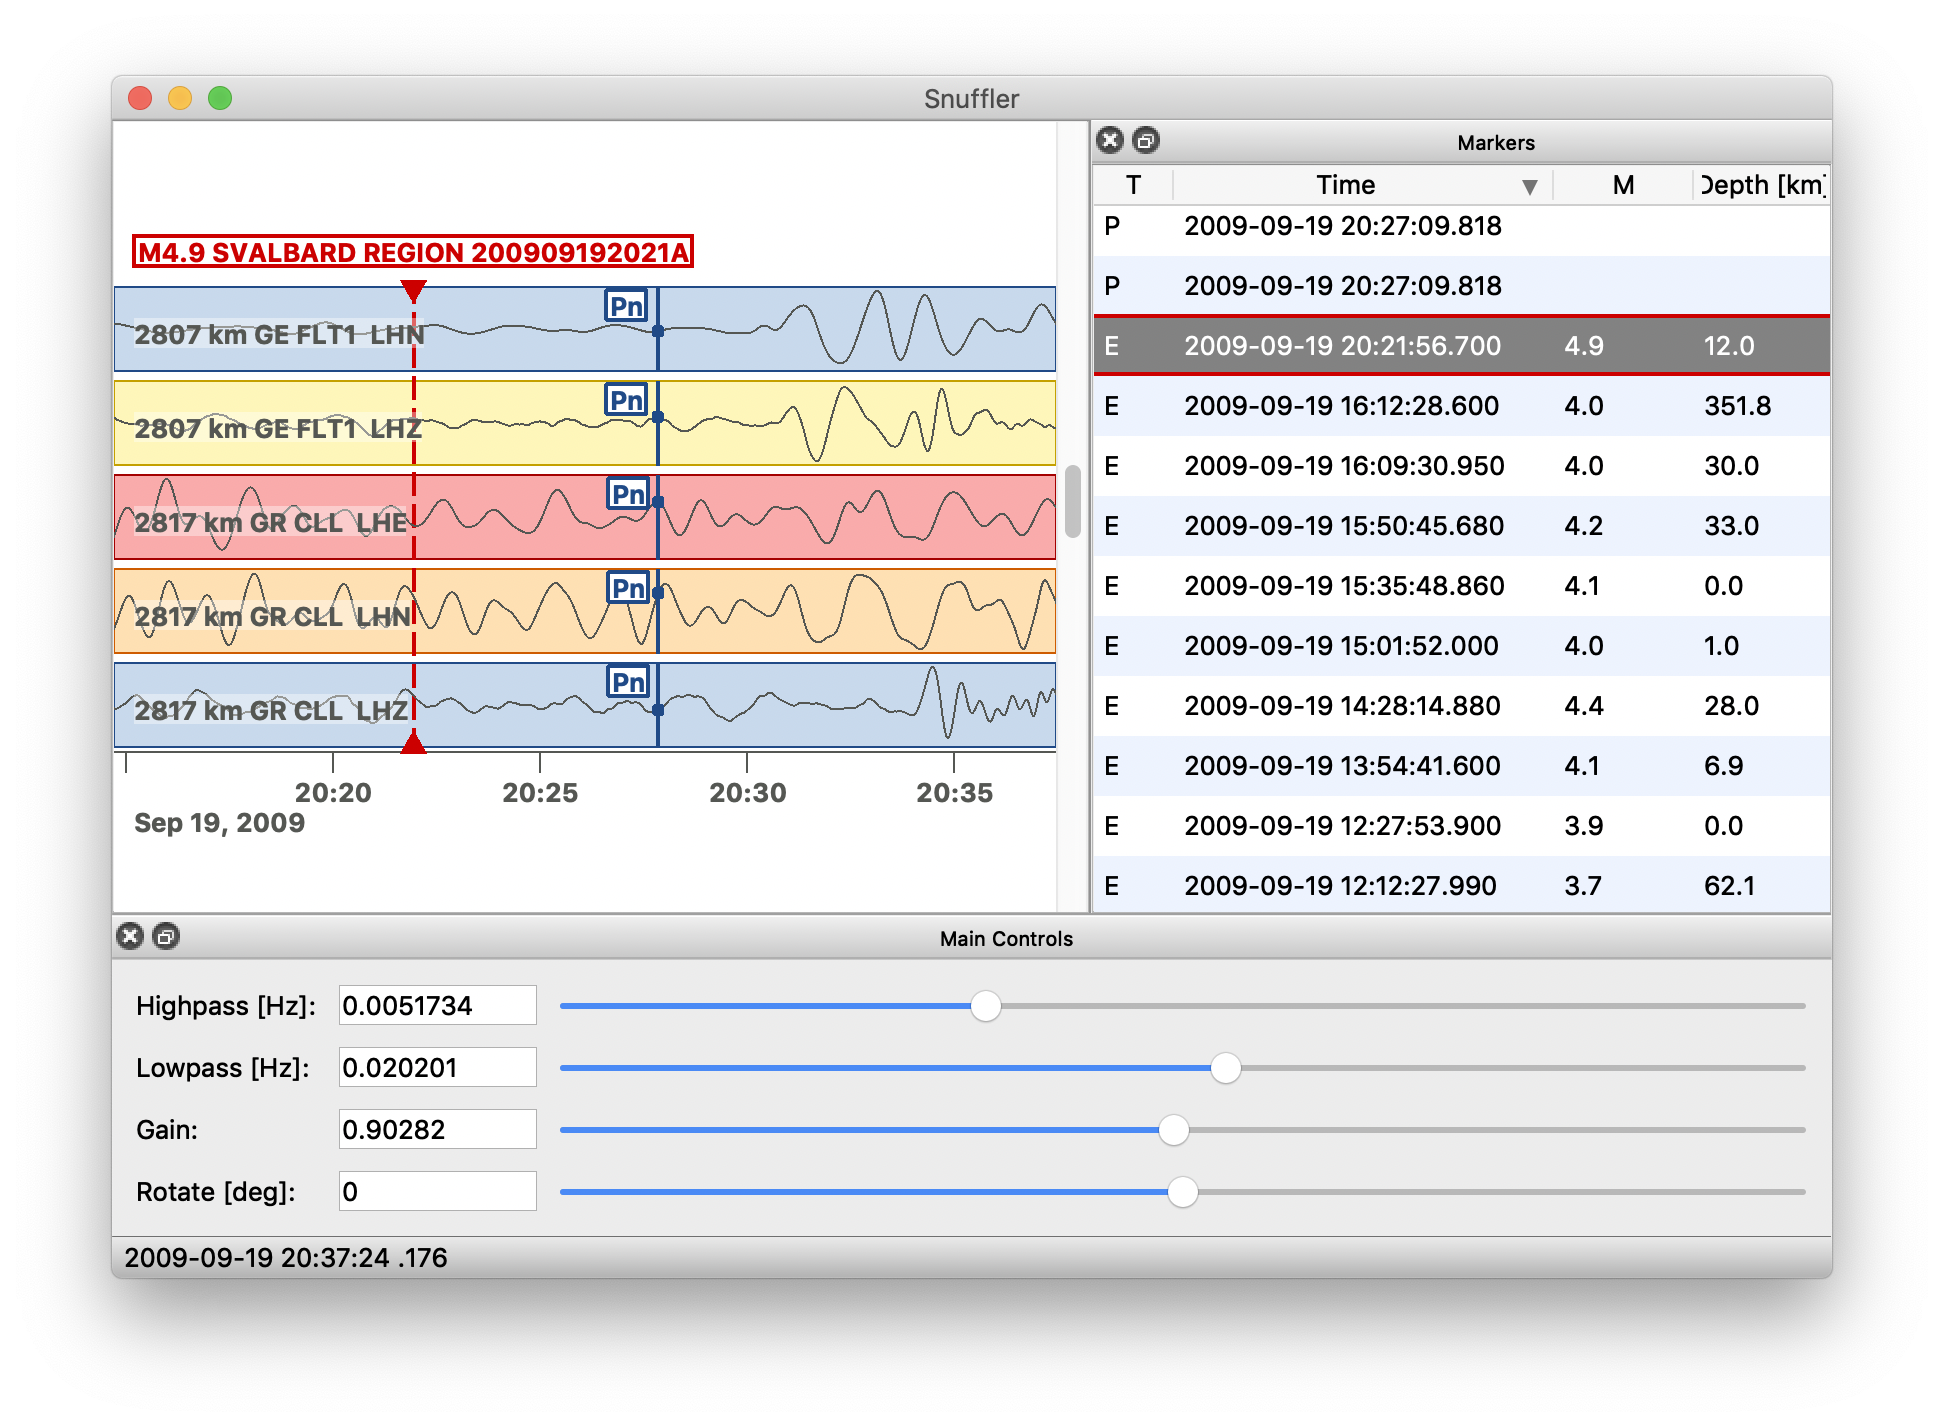
A table listing all markers opens when pressing the key m. By default, columns indicating the type (T), the time and - if available - the magnitude (M) of an event marker’s associated event are displayed. Further columns can be added by right-clicking the table’s headers and activating the desired column. Left-click on a column’s header sorts the table by the values given in that column. The Label, Depth, Lat, Lon and the magnitude (M) can be set from within the table by a double-click on the underlying field.
Live seismograms
Snuffler can display incoming seismic waveforms in real-time. Install slinktool if you want to see data streams from a SeedLink server.
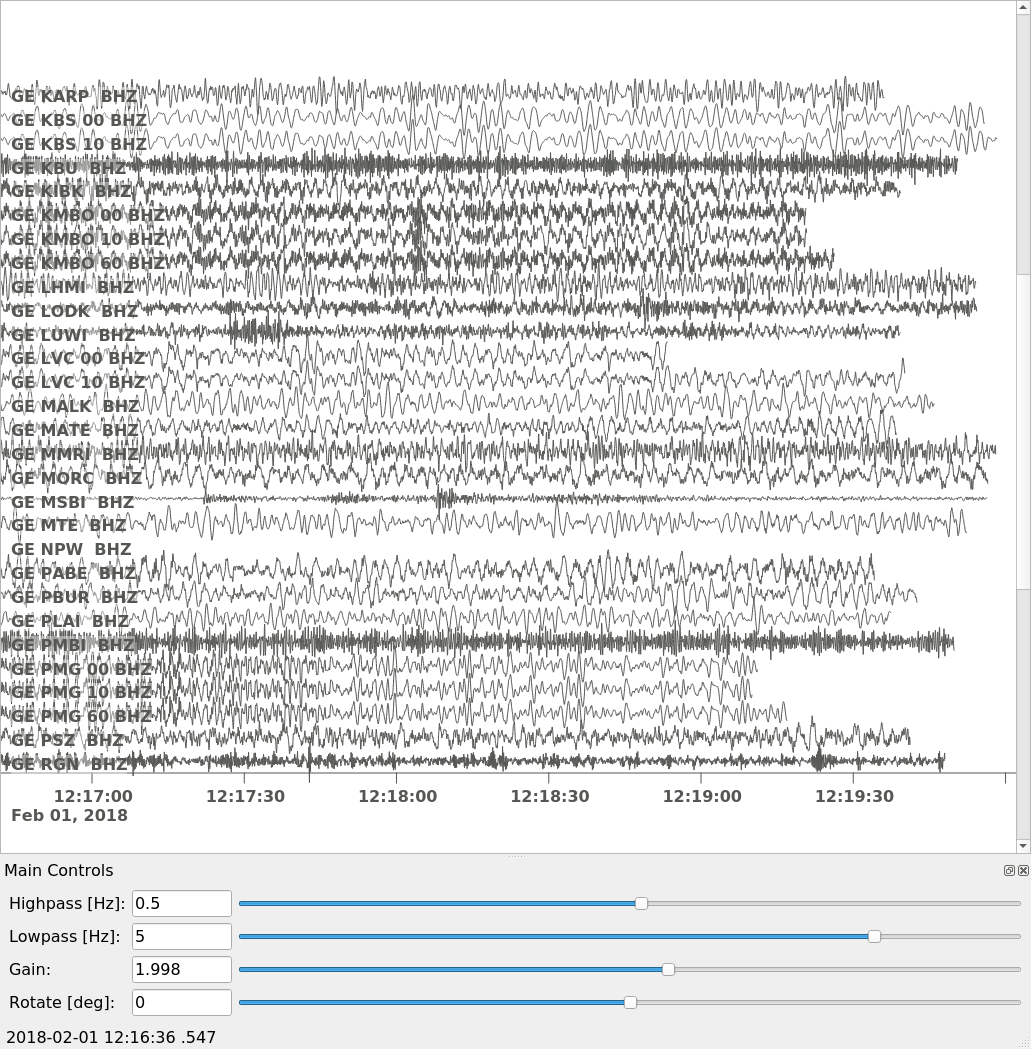
To show all available BHZ channels from the GE (GEOFON) network, run:
snuffler seedlink://geofon.gfz-potsdam.de/GE.*.*.BHZ --follow=200
geofon.gfz-potsdam.de is the SeedLink server to access and the option
--follow tells Snuffler that it should continuously display
the last 200 seconds from real-time (right edge of the screen is current time).
Time to lean back and watch seismograms coming in from all over the world.
If you interactively click into the window, it will interrupt the following mode for a while to give you a chance to look around with all the usual commands. It resumes to the real-time scrolling mode if you leave it alone for a while.
It is also possible to record the received seismograms into a data directory
for later investigations. To activate this feature, use the --store-interval and --store-path command line options:
snuffler seedlink://geofon.gfz-potsdam.de/GE.*.*.BHZ --follow=200 \
    --store-interval=1000  \
    --store-path='datadump/%(network)s.%(station)s.%(location)s.%(channel)s.%(tmin)s.mseed'
The template given to --store-path will be
used to create file names (and directories) as needed, expanding the
'%(variable)s' placeholders with metadata from the waveforms. The
--store-interval tells Snuffler after
intervals of how many seconds, the seismograms should be dumped to file.
Remotely stored data
If you want to access and work with remotely stored data from a local PC there are basically three options: VNC, X-forwarding and SSHFS. When using SSHFS your remote repository is mounted locally via SSH. Scanning large data holdings initially with Snuffler (when data is stored in Mini-SEED format), may require large amounts of data to be transferred through the SSH connection. X-forwarding is as if you are running your program locally, when it’s really running on the remote end. The graphic instructions generated by the program are transferred over the network. For Snuffler this needs great bandwidth and can be very slow. VNC instead lets the remote PC do all the graphics drawing and sends you just ‘screenshots’ which often works faster with Snuffler. So here a short instruction on how VNC can be set up for working with remotely stored data. We will use TightVNC to run a virtual X Server with its own desktop.
To install on Ubuntu:
sudo apt install tightvncserver tightvncpasswd
Set your password for the VNC server:
tightvncpasswd # asks for new password and sets it
Before starting the VNC server, it might be necessary to configure the desktop environment used by the VNC on your remote machine. Gnome isn’t optimal here because it has high demands on the system graphics. It is better to use a lightweight alternative like LXDE, XFCE, Mate, Openbox or Notion.
For example if we would like to use XFCE, install it first:
sudo apt install xfce4
Then configure the TightVNC server to use it. Open the file ~/.vnc/xstartup
and write:
#/bin/sh
unset SESSION_MANAGER
unset DBUS_SESSION_BUS_ADDRESS
startxfce4
Make the file executable:
chmod a+x ~/.vnc/xstartup
Now start your virtual X server on your remote host:
tightvncserver -localhost # is running on localhost, port 5902
Open an SSH tunnel from your local machine to the VNC port on the remote:
ssh -L 5902:localhost:5902 user@machine
Now you can start a VNC client on the local machine and connect to local port 5092. On Linux you can use Vinagre, for example.