
Single force inversion from landslide observations
This step-by-step guide explains how to obtain a probabilistic single force (SF) solution for a landslide occurred in Val Bondasca, Switzerland on 23-08-2017 using Grond.
Setup
To repeat this exercise on your machine, you should first install Pyrocko and Grond (see Installation), if you have not already done so. Then create the example project with:
grond init example_landslide grond-playground-landslide/
The project folder
The project folder now contains a configuration file for Grond, some utility scripts to download pre-calculated Green’s functions and to download seismic waveforms from public data centres.
grond-playground-landslide  # project folder
├── bin                          # directory with scripts
│   ├── download_gf_stores.sh    # download pre-calculated Green's functions
│   ├── grondown                 # a simple event-based waveform downloader
│   └── grondown.command         # command used to download data for this exercise
└── config                       # directory for configuration files
    └── example_landslide.gronf  # Grond configuration file for this exercise
Green’s function download
To download the pre-calculated Green’s functions needed in this exercise, run
bin/download_gf_stores.sh
When the command succeeds, you should have a new subdirectory gf_stores in your project folder:
gf_stores
└── crust2_pa_sf/... # Green's function store
It contains a Pyrocko Green’s function store, named crust2_pa_sf, which has been created using the Fomosto tool of Pyrocko and the modelling code QSEIS. The Green’s functions in this store have been calculated for a regional Crust2x2 earth model for source depths between 0 and 300 m in 100 m steps and it is sampled at 2 Hz.
Note
Note that for a single force model the GF number of components is changed to 5. This is defined by ncomponents in gf_Stores/config.
Seismic waveform data download
A preconfigured command is provided to download seismic waveform recordings via FDSN web services from the IRIS and GEOFON data center. The command defines time and location of the event and a distance range to download the data.
To download the seismic waveform data, run:
bin/grondown 2017-08-23 07:30:00 46.3 9.6 0 200 0.01 2.0 bondo2017 --sites=geofon,iris --padding-factor=10
This shell script calls the data downloader bin/grondown with parameters appropriate to get a dataset of broadband seismometer recordings, sufficient for a single force optimisation. It performs the following steps for us:
Query GEOFON to get event information from the catalogue.
Select time windows based on event origin and time, considering that we want to analyse the signals at low frequencies (0.05 - 0.2 Hz).
Query data centres for seismic stations with epicentral distance between 0 and 200 km.
From the available recorder channels select appropriate ones for a target sampling rate of 2 Hz.
Download raw waveform data for the selected stations and channels.
Download instrument transfer function meta-information for all successfully downloaded waveform data.
Calculate displacement seismograms for quality check (Grond will use the raw data). If all went well, the displacement seismograms should be valid in the frequency range 0.05 - 0.2 Hz and rotated to radial, transverse, and vertical components. The rotation to radial and transverse components is with respect to the event coordinates from the GEOFON catalogue.
After running the download script, the playground directory should contain a new data directory with the following content:
data
└── events
    └── bondo2017
        ├── event.txt                 # catalogue information about the event
        └── waveforms
            ├── grondown.command
            ├── prepared/...          # rotated, displacement waveforms
            ├── raw/...               # raw Mini-SEED waveforms
            ├── rest/...
            ├── stations.geofon.xml   # instrument response information
            ├── stations.iris.xml
            ├── stations.prepared.txt # stations files for Snuffler
            └── stations.raw.txt
Because of various data problems, like missing instrument response information, gappy traces, data inconsistencies and what not, only about half of the initially requested stations will be useful in the optimisation. Some problems are not detected by the downloader, so we will have to look at the seismograms.
Data screening
For a quick visual inspection of the dataset, we can use the Snuffler program contained in Pyrocko.
cd data/events/bondo2017/waveforms
snuffler --event=../event.txt --stations=stations.prepared.txt prepared
cd -  # change to previous folder
Figure 1 shows our view after some interactive adjustments in Snuffler. In particular, we may want to
sort the traces according to epicentral distance (Menu → check Sort by Distance).
configure display style (Menu → uncheck Show Boxes, uncheck Clip Traces).
filter between 0.05 and 0.2 Hz.
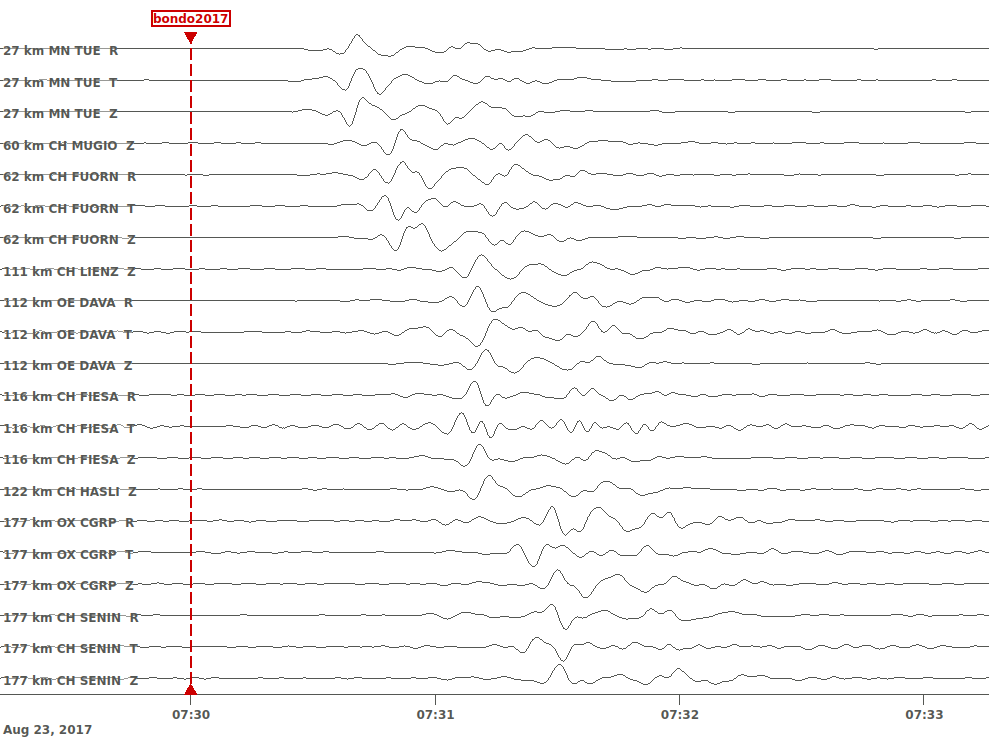
Figure 1: Displacement seismograms in Z, R and T components for surface wave SF optimisation as viewed in the waveform browser Snuffler.
Grond configuration
The project folder already contains a configuration file for SF optimisation with Grond, so let’s have a look at it. It is a YAML file. If you have never heard about this file format, read section Configuration file structure and format (YAML) for an overview.
%YAML 1.1
# Example: Single force inversion from landslide observations.
--- !grond.Config
path_prefix: ../
rundir_template: runs/${problem_name}.grun
dataset_config: !grond.DatasetConfig
  stations_stationxml_paths: ['data/events/${event_name}/waveforms/stations.geofon.xml', 'data/events/${event_name}/waveforms/stations.iris.xml']
  events_path: data/events/${event_name}/event.txt
  waveform_paths: ['data/events/${event_name}/waveforms/raw']
  responses_stationxml_paths: ['data/events/${event_name}/waveforms/stations.geofon.xml', 'data/events/${event_name}/waveforms/stations.iris.xml']
  extend_incomplete: false
  picks_paths: []
  blacklist_paths: []
  blacklist: []
  whitelist_paths: []
target_groups:
- !grond.WaveformTargetGroup
  normalisation_family: td
  path: td.rayleigh
  weight: 1.0
  interpolation: nearest_neighbor
  store_id: crust2_pa_sf
  distance_min: 1000.0
  distance_max: 200000.0
  exclude: []
  channels: [Z, R]
  misfit_config: !grond.WaveformMisfitConfig
    quantity: displacement
    fmin: 0.05
    fmax: 0.2
    ffactor: 1.5
    tmin: '{stored:any_P}-60'
    tmax: '{stored:any_P}+60'
    domain: time_domain
    norm_exponent: 1
    tautoshift_max: 4.0
    autoshift_penalty_max: 0.05
- !grond.WaveformTargetGroup
  normalisation_family: td
  path: td.love
  weight: 1.0
  interpolation: nearest_neighbor
  store_id: crust2_pa_sf
  distance_min: 1000.0
  distance_max: 200000.0
  exclude: []
  channels: [T]
  misfit_config: !grond.WaveformMisfitConfig
    quantity: displacement
    fmin: 0.05
    fmax: 0.2
    ffactor: 1.5
    tmin: '{stored:any_P}-60'
    tmax: '{stored:any_P}+60'
    domain: time_domain
    norm_exponent: 1
    tautoshift_max: 4.0
    autoshift_penalty_max: 0.05
problem_config: !grond.SFProblemConfig
  name_template: sf_${event_name}_0.05_0.2
  norm_exponent: 1
  ranges:
    depth: 100 .. 100
    duration: 1 .. 1
    east_shift: -10000 .. 10000
    north_shift: -10000 .. 10000
    fd: -9e+10 .. 9e+10
    fe: -9e+10 .. 9e+10
    fn: -9e+10 .. 9e+10
    time: 15 .. 35 | add
  distance_min: 0.0
  stf_type: HalfSinusoidSTF
  nthreads: 1
analyser_configs:
- !grond.TargetBalancingAnalyserConfig
  niterations: 1000
  use_reference_magnitude: false
optimiser_config: !grond.HighScoreOptimiserConfig
  sampler_phases:
  - !grond.UniformSamplerPhase
    niterations: 1000
    ntries_preconstrain_limit: 1000
  - !grond.DirectedSamplerPhase
    niterations: 5000
    ntries_preconstrain_limit: 1000
    scatter_scale_begin: 2.0
    scatter_scale_end: 0.7
    starting_point: excentricity_compensated
    sampler_distribution: normal
    standard_deviation_estimator: median_density_single_chain
    ntries_sample_limit: 1000
  chain_length_factor: 8.0
  nbootstrap: 100
engine_config: !grond.EngineConfig
  gf_stores_from_pyrocko_config: false
  gf_store_superdirs: [gf_stores]
  gf_store_dirs: []
event_names: []
event_names_exclude: []
Configured like this, Grond will try to fit Rayleigh waves in the frequency range 0.05 to 0.2 Hz on the vertical (Z) and radial (R) components as well as Love waves on the transverse (T) component of ground displacement. The mismatch between observation and modelling will be measured using an L1 norm.
Checking the optimisation setup
Before running the actual optimisation, we can now use the command
grond check config/example_landslide.gronf bondo2017
to run some sanity checks. In particular, Grond will try to run a few forward models to see if the modelling works and if it can read the input data. If only one event is available, we can also neglect the event name argument in this and other Grond commands.
To get some more insight into the setup, we can run
grond report -so config/example_landslide.gronf bondo2017
This will plot some diagnostic figures, create web pages in a new directory report, and finally open these in a web browser.
Starting the optimisation
Let’s start the optimisation with:
grond go config/example_landslide.gronf
During the optimisation a status monitor will show the optimisation’s progress.
Depending on the configured number of iterations and the computer’s hardware the optimisation will run several minutes to hours.
Optimisation report
Once the optimisation is finished we can generate and open the final report with:
grond report -so runs/sf_bondo2017.grun
Example report
Explore the online example reports to see what information the inversion reveals.