pyrocko.plot.response
This module contains functions to plot instrument response transfer functions in Bode plot style using Matplotlib.
Example
from pyrocko.plot import response
from pyrocko.example import get_example_data

get_example_data('test_response.resp')

resps, labels = response.load_response_information(
    'test_response.resp', 'resp')

response.plot(
    responses=resps, labels=labels, filename='test_response.png',
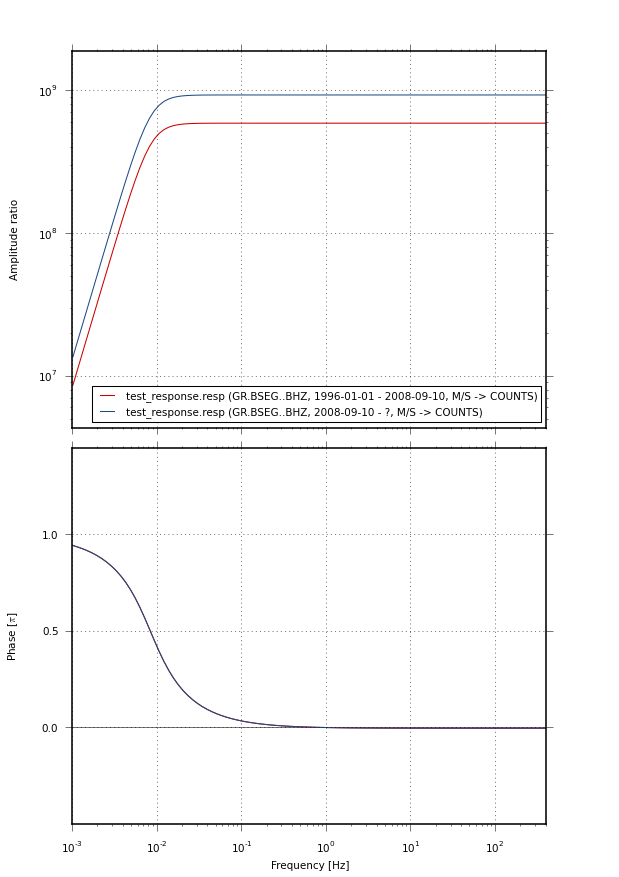
    fmin=0.001, fmax=400., dpi=75.)

Example response plot
Functions
|
Draw instrument response in Bode plot style to given Matplotlib axes |
|
Draw instrument responses in Bode plot style. |
|
Configure axes in Bode plot style. |
- draw(response, axes_amplitude=None, axes_phase=None, fmin=0.01, fmax=100.0, nf=100, normalize=False, style={}, label=None, show_breakpoints=False, color_pool=None, label_pool=None)[source]
Draw instrument response in Bode plot style to given Matplotlib axes
- Parameters:
response – instrument response as a
pyrocko.response.FrequencyResponseobjectaxes_amplitude –
matplotlib.axes.Axesobject to use when drawing the amplitude responseaxes_phase –
matplotlib.axes.Axesobject to use when drawing the phase responsefmin – minimum frequency [Hz]
fmax – maximum frequency [Hz]
nf – number of frequencies where to evaluate the response
style –
dictwith keyword arguments to tune the line stylelabel – string to be passed to the
labelargument ofmatplotlib.axes.Axes.plot()
- plot(responses, filename=None, dpi=100, fmin=0.01, fmax=100.0, nf=100, normalize=False, fontsize=10.0, figsize=None, styles=None, labels=None, show_breakpoints=False, separate_combined_labels=None)[source]
Draw instrument responses in Bode plot style.
- Parameters:
responses – instrument responses as
pyrocko.response.FrequencyResponseobjectsfmin – minimum frequency [Hz]
fmax – maximum frequency [Hz]
nf – number of frequencies where to evaluate the response
normalize – if
Truenormalize flat part of response to be1styles –
listofdictobjects with keyword arguments to be passed to matplotlib’smatplotlib.axes.Axes.plot()function when drawing the response lines. Length must match number of responses.filename – file name to pass to matplotlib’s
savefigfunction. IfNone, the plot is shown withmatplotlib.pyplot.show().fontsize – font size in points used in axis labels and legend
figsize –
tuple,(width, height)in incheslabels –
listof names to show in legend. Length must correspond to number of responses.show_breakpoints – show breakpoints of pole-zero responses.