
Cake manual
Cake is a tool which can be used to solve classical seismic ray theory problems for layered earth models (layer cake models).
For various seismic phases it can calculate:
arrival times
ray paths
reflection and transmission coefficients
take-off and incidence angles
geometrical spreading factors
Computations are done for a spherical earth. Cake can either be run as a command line tool or used as a Python module. Both is demonstrated in the examples below.
Invocation
cake <subcommand> [options]
Subcommands:
get information on model/phase/material properties
- arrivals
print list of phase arrivals
- paths
print ray path details
- plot-xt
plot traveltime vs distance curves
- plot-xp
plot ray parameter vs distance curves
- plot-rays
plot ray propagation paths
- plot
plot combination of ray and traveltime curves
- plot-model
plot velocity model
- list-models
list builtin velocity models
- list-phase-map
show translation table for classic phase names
- simplify-model
create a simplified version of a layered model
- scatter
show details about scattering at model interfaces
To get further help and a list of available options for any subcommand run:
cake <subcommand> --help
Options
Each subcommand has its own set of options. Use cake <subcommand> --help to
see which of the following options apply to any of the subcommands listed
above.
Phases:
Seismic phase arrivals may be either specified as traditional phase names
(e.g. P, S, PP, PcP, …) or in Cake’s own syntax which is more powerful.
Use the --classic option, for traditional phase names. Use the --phase
option if you want to define phases in Cake’s syntax.
- --phase=PHASE1,PHASE2,..., --phases=PHASE1,PHASE2,...
Comma separated list of seismic phases in Cake’s syntax.
The definition of a seismic propagation path in Cake’s phase syntax is a string consisting of an alternating sequence of legs and knees.
A leg represents seismic wave propagation without any conversions, encountering only super-critical reflections. Legs are denoted by
P,p,S, ors. The capital letters are used when the take-off of the leg is in a downward direction, while the lower case letters indicate a take-off in an upward direction.A knee is an interaction with an interface. It can be a mode conversion, a reflection, or propagation as a headwave or diffracted wave.
conversion is simply denoted as:
(INTERFACE)orDEPTHupperside reflection:
v(INTERFACE)orvDEPTHunderside reflection:
^(INTERFACE)or^DEPTHnormal kind headwave or diffracted wave:
v_(INTERFACE)orv_DEPTH
The interface may be given by name or by depth: INTERFACE is the name of an interface defined in the model, DEPTH is the depth of an interface in [km] (the interface closest to that depth is chosen). If two legs appear consecutively without an explicit knee, surface interaction is assumed.
The preferred standard interface names in cake are
conrad,moho,cmb(core-mantle boundary), andicb(inner core boundary).The phase definition may end with a backslash
\, to indicate that the ray should arrive at the receiver from above instead of from below. It is possible to restrict the maximum and minimum depth of a leg by appending<(INTERFACE)or<DEPTHor>(INTERFACE)or>DEPTHafter the leg character, respectively.
- --classic=PHASE1,PHASE2,...
Comma separated list of seismic phases in classic nomenclature. Run
cake list-phase-mapfor a list of available phase names.
Model:
- --model=(NAME or FILENAME)
Use builtin model named NAME or user model from file FILENAME. By default, the “ak135-f-continental.m” model is used. Run
cake
list-models
for a list of builtin models.
- --format=FORMAT
Set model file format (available: nd, hyposat; default: nd).
- --crust2loc=LAT,LON
Set model from CRUST2.0 profile at location (LAT,LON).
Source-receiver geometry:
- --sdepth=FLOAT
Source depth [km] (default: 0)
- --rdepth=FLOAT
Receiver depth [km] (default: 0)
- --distances=DISTANCES
Surface distances as
start:stop:nordist1,dist2,...[km]
Material:
An isotropic elastic material may be specified by giving a combination of some of the following options.
- --vp=FLOAT
P-wave velocity [km/s]
- --vs=FLOAT
S-wave velocity [km/s]
- --rho=FLOAT
density [g/cm**3]
- --qp=FLOAT
P-wave attenuation Qp (default: 1456)
- --qs=FLOAT
S-wave attenuation Qs (default: 600)
- --poisson=FLOAT
Poisson ratio
- --lambda=FLOAT
Lame parameter lambda [GPa]
- --mu=FLOAT
Shear modulus [GPa]
- --qk=FLOAT
Bulk attenuation Qk
- --qmu=FLOAT
Shear attenuation Qmu
General:
- -h, --help
Show help message and exit.
- --vred=FLOAT
Velocity for time reduction in plot [km/s]
- --degrees
Distances are in [deg] instead of [km], velocities in [deg/s] instead of [km/s].
- --accuracy=MAXIMUM_RELATIVE_RMS
Set accuracy for model simplification.
- --slowness=FLOAT
Select surface slowness [s/km] (default: 0)
- --interface=(NAME or DEPTH)
Name or depth [km] of interface to select
Command line examples
Plot P and p phases
Ten receiver distances ranging from 100 km to 1000 km and a source depth of 10km.
cake plot-rays --crust2loc=45,10 --phases=P,p --sdepth=10 --distances=100:1000:10
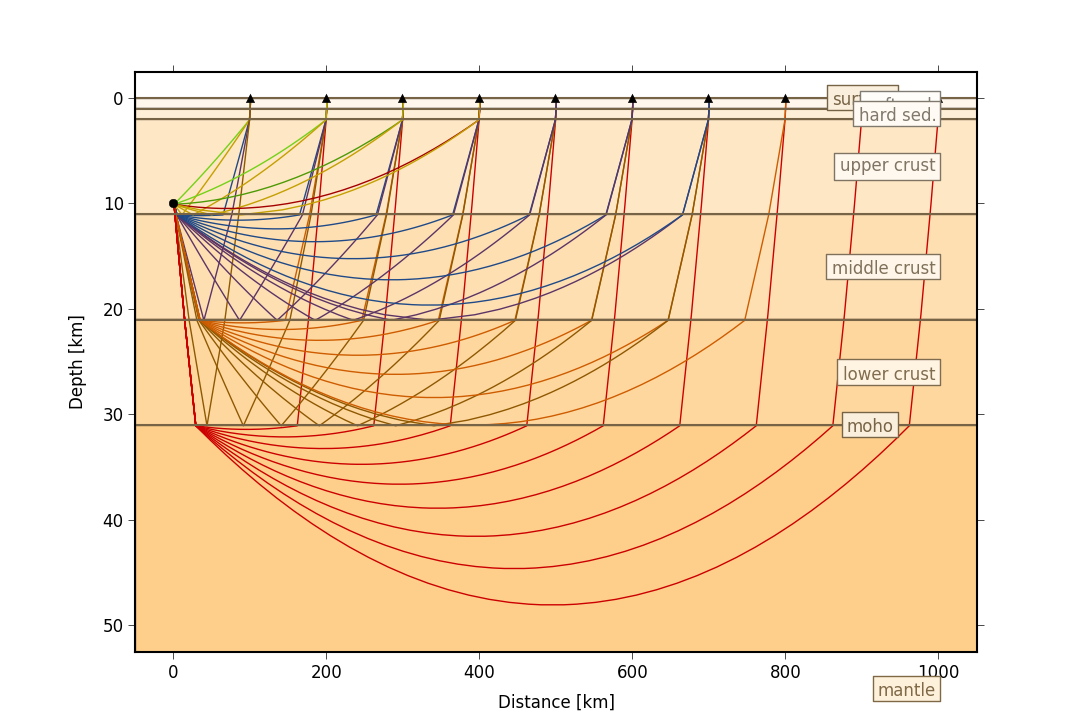
The option --crust2loc refers to the pyrocko.dataset.crust2x2 module and expects latitude and longitude of the source location.
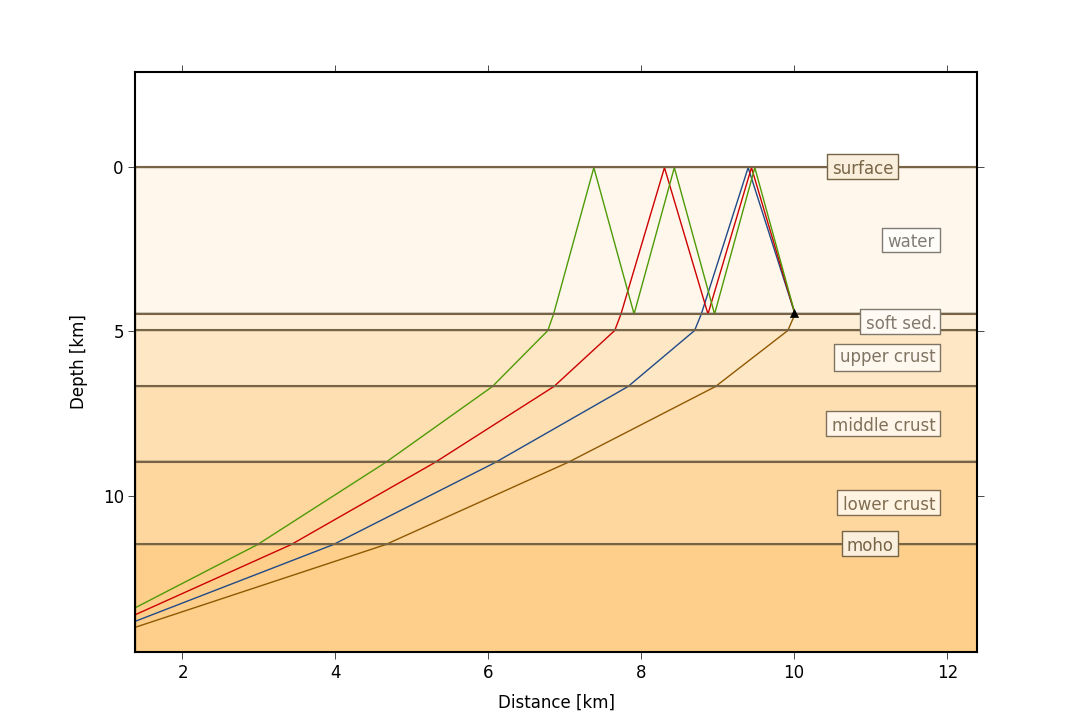
Some water multiples
Receivers may be at any depth. Arbitrary reflection/conversion histories may be choosen.
cake plot-rays --sdepth=15 --distances=10 --rdepth=4.443 --crust2loc=0,0 \
               --phase='pP\,pPv3pP\,pPv3pPv3pP\,p'
To print arrival times and other ray parameters, replace plot-rays with
arrivals in the command line above.
> cake arrivals --sdepth=15 --distances=10 --rdepth=4.443 --crust2loc=0,0 \
              --phase='pP\,pPv3pP\,pPv3pPv3pP\,p'

slow    dist  time   take inci effi spre phase             used
s/km    km    s      deg  deg  %    %
----------------------------------------------------------------------------
0.09711 10.00 2.3147  128 10.6 58.7  103 p                 (p)
0.09099 10.00 8.1792  132 97.8 49.2  725 pP\               (p^0P\)
0.08461 10.00 14.052  136 97.3 8.03  729 pPv3pP\           (p^0Pv4.443p^0P\)
0.07835 10.00 19.931  140 96.8 1.32  710 pPv3pPv3pP\       (p^0Pv4.443p^0Pv4.443p^0P\)
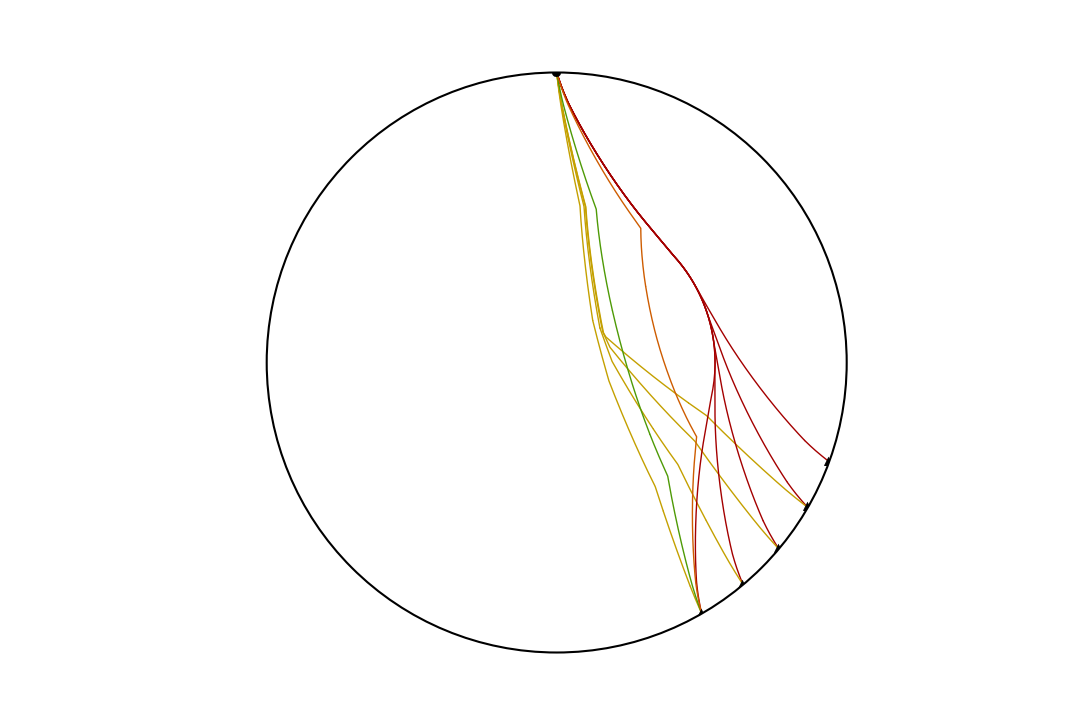
Classic phase names
To use classic phase names, use the --classic option:
cake plot-rays --classic=Pdiff,PKP,PKIKP --distances=110:150:5 --degrees
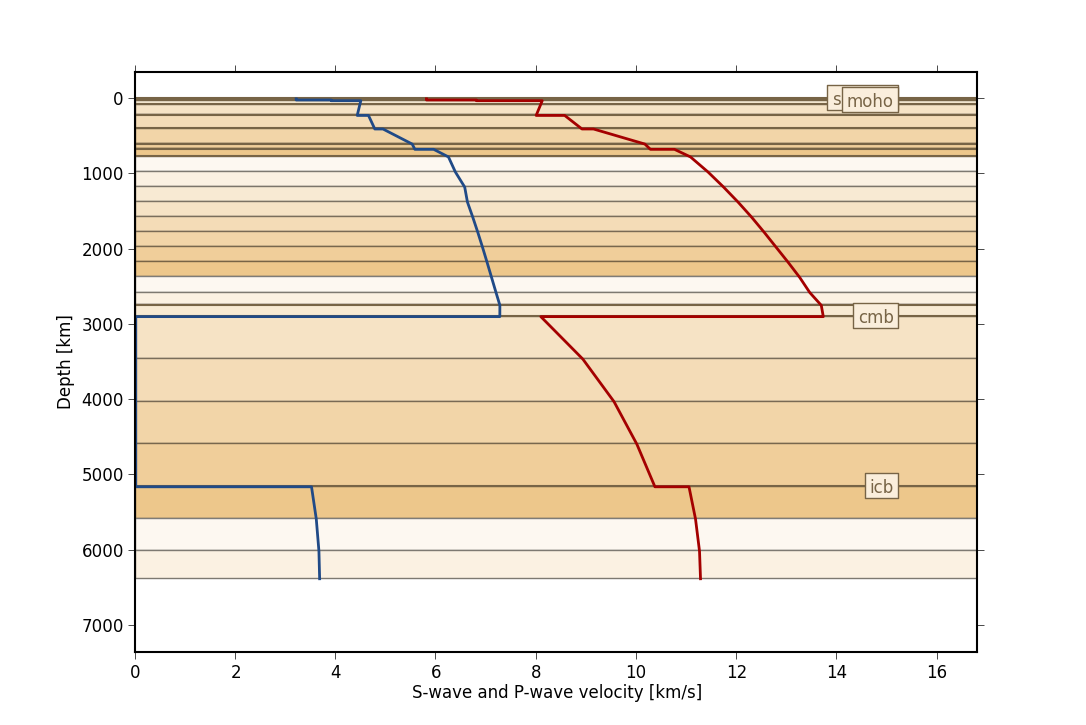
Model plots
cake plot-model --model=prem-no-ocean.m
Cake phases
It is possible to see the exact definition of a phase using cake print ...:
> cake print --classic=Pg
Phase definition "P<(moho)":
 - P mode propagation, departing downward (may not propagate deeper than interface moho)
 - arriving at target from below
Phase definition "p<(moho)":
 - P mode propagation, departing upward (may not propagate deeper than interface moho)
 - arriving at target from below
This tells us that the classic Pg phase is represented with two Cake style phase definitions, one for downgoing and one for upgoing takeoff direction and that there is a constraint on maximum depth.
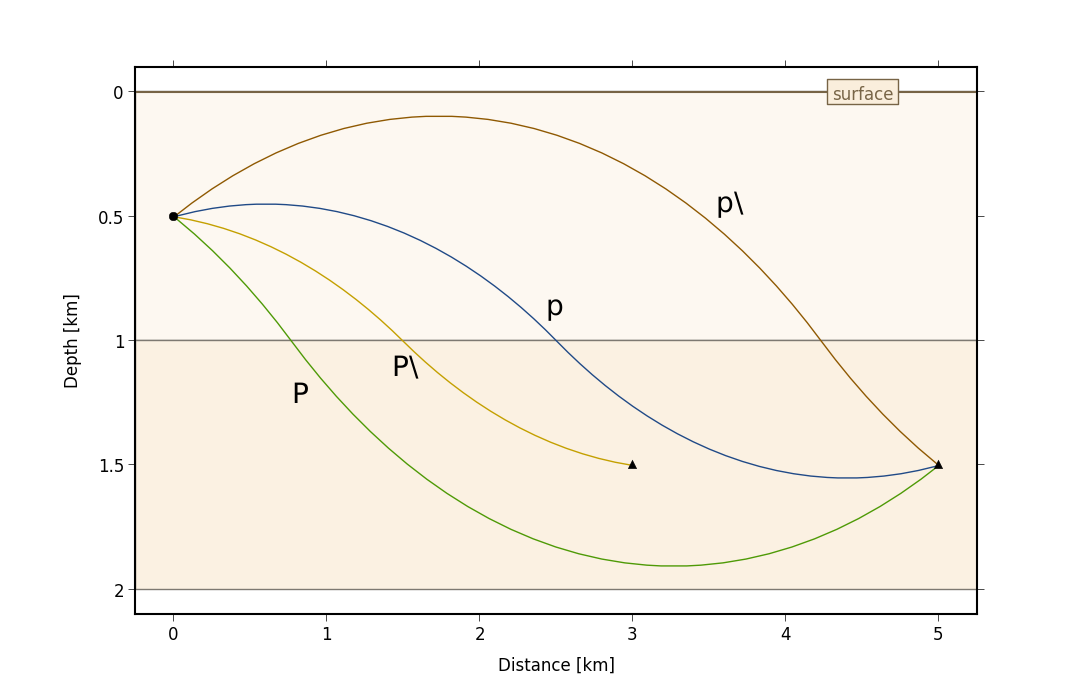
Here’s another example to illustrate why cake needs its special phase definition syntax:
> cat >waveguide.nd <<EOF
0 4 2.3  2.6
1 3 1.73 2.6
2 4 2.3  2.6
EOF
> cake plot-rays --phases='P,p,P\,p\' --sdepth=0.5 --rdepth=1.5 --distances=3,5 \
                 --model=waveguide.nd
Material calculator
Cake can also be used to convert between different material parameters:
> cake print --vp=5 --poisson=0.25
P wave velocity     [km/s]    :            5
S wave velocity     [km/s]    :      2.88675
P/S wave vel. ratio           :      1.73205
Lame lambda         [GPa]     :      21.6667
Lame shear modulus  [GPa]     :      21.6667
Poisson ratio                 :         0.25
Bulk modulus        [GPa]     :      36.1111
Young's modulus     [GPa]     :      54.1667
Rayleigh wave vel.  [km/s]    :      2.65408
Density             [g/cm**3] :          2.6
Qp                            :         1350
Qs = Qmu                      :          600
Qk                            :          inf
Energy scatter at interface
The scatter subcommand may be used to see how much energy (in percent) is
transmitted through or reflected by an interface for any given surface
slowness (P-SV case):
> cake scatter --interface=moho --slowness=0.0
interface "moho" (35 km)

             4.349       3.209                     95.65       96.79
  \P         /P      \S  /S                        /P          /S
  ----------------   ----------------   ----------------   ----------------
             \P          \S             /P         \P      /S  \S
             95.65       96.79                     4.349       3.209


> cake scatter --interface=moho --slowness=0.15
interface "moho" (35 km)

      3.899  92.69       1.859  3.899       94.24  3.411
  \P  /S     /P      \S  /S     /P          /S     /P
  ----------------   ----------------   ----------------
      \S                 \S             /S  \S
      3.411              94.24              2.347
Python script examples
Calculate P-phase arrivals
The following Python script calculates arrival times for the P-phase emitted by an event in a depth of 300km.
'''
Calculate P-phase arrivals.
'''

from pyrocko import cake
import numpy as num

km = 1000.

# Load builtin 'prem-no-ocean' model (medium resolution)
model = cake.load_model('prem-no-ocean.m')

# Source depth [m].
source_depth = 300. * km

# Distances as a numpy array [deg].
distances = num.linspace(1500, 3000, 16)*km * cake.m2d

# Define the phase to use.
Phase = cake.PhaseDef('P')

# calculate distances and arrivals and print them:
print('distance [km]      time [s]')
for arrival in model.arrivals(distances, phases=Phase, zstart=source_depth):
    print('%13g %13g' % (arrival.x*cake.d2m/km, arrival.t))